Getting the PFM basics right (A study of PEFA scores awarded over the 2016 and 2011 Frameworks)

By David Fellows and John Leonardo

Introduction

The Public Expenditure and Financial Accountability (PEFA) programme provides a framework for assessing and reporting the strengths and weaknesses of public financial management (PFM). The current 2016 Framework refines the previous 2011 Framework and is structured under a hierarchy of 6 Pillars, 31 Indicators (PIs) and 94 Dimensions. The PEFA Field Guide explains the components of the 2016 Framework and describes how an assessment team should score each dimension on a scale of A to D, a D score representing the lowest level of performance.

An initial assessment of the latest PEFA reports for countries published under the 2016 Framework suggested that many countries were not getting the PFM basics right. This led to a comparison of recent results with those from earlier PEFA reports prepared under the 2011 Framework to examine performance over time and the lessons for PFM improvement that such a comparison may offer (termed the ‘dual study’). It was decided to focus on dimension scores since the demands of PFM can change markedly depending on the aspects of the subject matter under consideration and the evident variations of score for the same country at dimension level within a range of PIs.

It was decided to confine this initial study to the analysis of D scores at the dimension level given the frequency of D scores, the very poor performance they represent and the importance of raising performance to a higher level. The Field Guide requires a D score when: ‘the feature being measured is present at less than the basic level of performance or is absent altogether, or that there is insufficient information to score the dimension’.

For the purpose of this study, D scores include dimensions marked D*, NR and some NA scores where evidence suggests a breakdown in PFM activity. It seemed evident that these attributions are often applied inconsistently and serve to obscure the extent of the poor performance of some countries by avoiding the use of justifiable D scores. A summary of all scores for the 2016 Framework and the dual study evaluations, as discussed in this report, can be accessed at Annex 1.

2016 Framework analysis

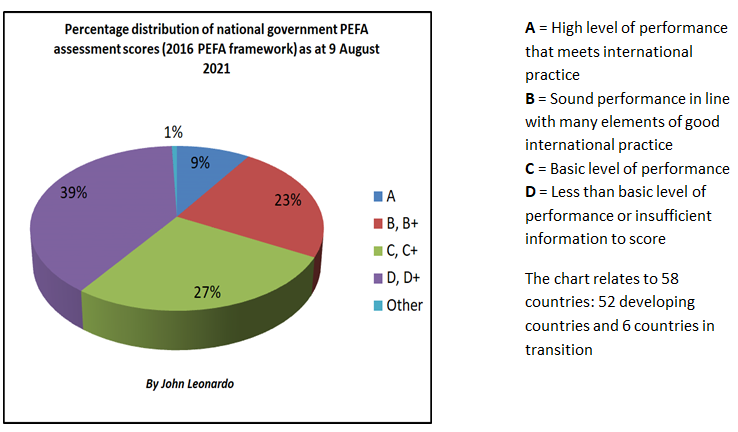
The 2016 Framework analysis consisted of the latest published evaluations for the 63 countries for which there were published reports at the time of this study. The D scores represent 32% of all dimension scores in this data set, 39% amongst low-income countries.

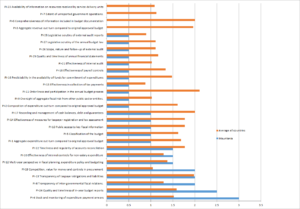
D scores were widely distributed throughout the framework with 45 of the 94 dimensions having an above average number of D scores.

The study also defined and assessed the key factors (termed descriptors) that contributed to PFM performance. The results, summarised at  Annex 2, suggested that most D scores can be explained by the absence of ‘Management Effectiveness’, ‘Integrity’ and in one case of ‘High Level Technical Knowledge’ although poor “System Design” was another potentially important contributing factor.

Annex 3 provides a full list of the 2016 Framework dimensions and D score data together with the descriptors contributing to each dimension.

Dual framework

Following the results of the 2016 Framework D score study it was decided to undertake a review of 45 countries that have undertaken at least one PEFA evaluation under both the 2011 and 2016 frameworks (the earliest and the latest studies we used for countries with more than two studies). This enabled a country’s performance to be compared over a five-year period.

The 2011 and 2016 PEFA frameworks differ in many respects. An equivalence table published by PEFA suggests that the two frameworks can be aligned to 37 “equivalent” dimensions on the basis that the respective dimensions were either “directly comparable” or “indirectly comparable”.

The PEFA equivalence table identifies 28 dimensions (or in some cases subsets) from the 2011 framework as “non-comparable (subject only)” to 2016 counterparts suggesting that the dimension descriptions and scoring routines differ markedly while the general area of relevance to the dimensions are similar. This leaves only 37 pairs of comparable dimensions.

On examination, the study team decided that 26 of the 28 pairs of dimensions judged “non-comparable (subject only)” were in fact very similar to the 2016 counterparts, the main difference being the way in which the later guidance is translated into clear-cut scoring criteria but that a good PEFA evaluator should have made reasonably similar judgements for both frameworks when reviewing all but two of these dimensions.

This exercise, therefore, recognises 63 equivalent dimensions while also providing results for PEFA’s 37 equivalent dimensions. It is suggested that the D score characteristics of both data sets are sufficiently similar to provide a reasonable validation for the larger 63 dimension equivalence thereby extending the usefulness of inter-framework comparisons. Details of the PEFA and PFMConnect equivalence tables are set out at Annex 4. The dual study of 2016 and 2011 Framework with D score data at dimension level is set out at  Annex 5.             

The dual study is highly concerning in terms of the lack of improvement amongst those dimensions receiving D scores. These data are further summarised and commented on below.

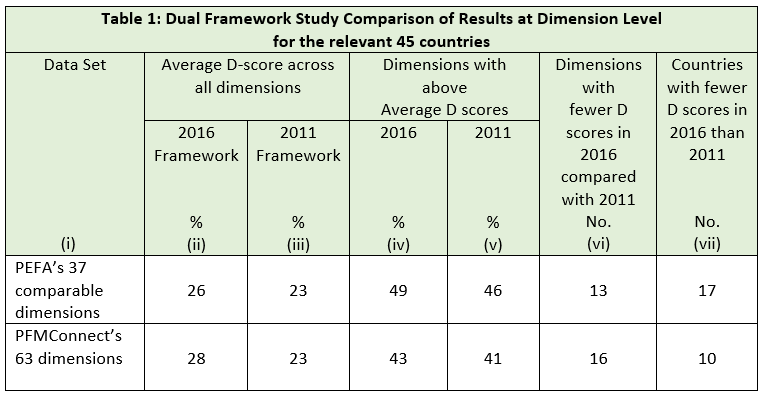
The dual framework study reveals a deteriorating performance with most dimensions exhibiting a greater number of D scores in the later evaluations. Only 13 (35%) of dimensions from the 37 dimensions study and 16 (25%) from the 63 dimensions study experienced reductions in D scores between evaluations.

When the dual evaluations for the same country were compared, see Annex 6, it was noted that most countries recorded a higher proportion of D scores for the same dimension in both evaluations demonstrating a reasonably consistent poor performance. A few countries displayed less consistent results.

Few countries in the 63 dimensions set recorded reductions in the number of D scores in 2016 framework results compared with the 2011 framework results. The top performers where significant PFM reform activities had been undertaken between the dual framework studies included: Philippines, Maldives, Mongolia and Tajikistan.

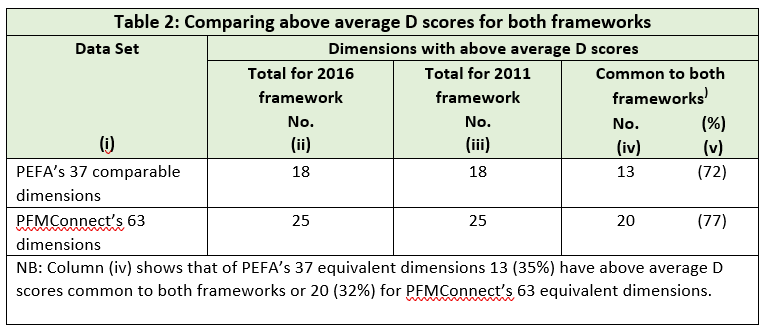
The results for the proportion of dimensions with above-average D scores that are common to both framework dimensions sets is concerning. Approximately one third of all dimensions had above-average D scores that were common to both frameworks for the same country for both datasets. In addition, over 70% of the above-average dimensions in both datasets were common to both frameworks showing limited improvement in the worst scoring areas over a five-year period.

Dimensions with regular poor performance are widely distributed (titles in red at Annex 6). This suggests pockets of poor management that remain in place without effective challenge and this is consistent with the descriptor analysis.

Conclusions

This study offers a range of findings that pose questions about the approach, effectiveness and sustainability of PFM reforms instituted by national and subnational governments often in collaboration with development agencies. The concerns about management effectiveness and integrity highlighted in this study must be seen to question the most basic aspects of any organisation.

The study focusses on D score analysis, but it could be useful to extend the analysis to C-level scores where the performance of countries still remains below good international standards. This could reveal new characteristics of national PFM performance and extend the range of analytical techniques applied to performance data.

The data analysis evidences the credibility of PFMConnect’s extended 63 dimension equivalence model that offers significant potential for more detailed studies of specific countries or regions.

Further work on descriptors to reveal contributory factors to variations in performance seems worthy of further development.

The failure of some governments to publish PEFA studies in full reinforces concerns about the need for greater attention to integrity. Another improvement that could be readily and widely implemented is legislative scrutiny of audit reports (PI 31).

Recommendations

We recommend that country-specific studies should be undertaken based on PEFA assessment reports (both 2016 Framework studies for the full 94 dimensions and dual studies where the data are available) examining D scores at dimension level to establish potential causes of poor performance and identify ways in which performance may be improved. Issues to consider with respect to areas of poor performance, include:

  • The commitment to personnel development and support, including: in-service training, management development, oversight, feedback on performance, and system design.
  • The adequacy of transparency and accountability and evidence of corrupt activity.
  • The quality of relevant communication and support levels among different departments and units of the finance ministry.
  • The reasons for persistently poor or erratic performance and the fit with other findings.
  • The observations of managers and staff on reasons for poor performance and barriers to improvement.

We recommend that country studies should be designed as the initial phase of PFM development programmes. In this context, a report by the Swedish International Development Cooperation Agency (SIDA) offers some observations about the conditions for effective PFM reform. These include the importance of change agendas being aligned with Government priorities and the need to treat PFM reform as a learning process with strong emphasis on coordination and systematic evaluation of the activities performed by teams responsible for delivery.

Groups of countries or subnational bodies may wish to collaborate in reform programmes enabling challenges and learning to be shared and systems of mutual support developed. We have previously advocated the use of digital communication as a cost-effective and time-saving way of sharing knowledge and ideas between nations (incl. expert advisors).

Any country, region or development institution wishing to participate in further work in this field is invited to discuss their interest with the authors.

An article based on this study has been published by the IMF’s PFM Blog.

PFMConnect is a public financial management consultancy with a particular interest in the use of digital communication to support learning and sharing expertise amongst the international development community.

David Fellows began his career in UK local government where he became President of the Society of Municipal Treasurers and a pioneer of digital government. He has held appointments in the UK Cabinet Office and the National Treasury of South Africa (david.fellows@pfmconnect.com).

John Leonardo is a PFM expert with extensive worldwide experience. He has undertaken PFM assignments in Africa, Asia, the Caribbean and the Pacific where he undertook PEFA assessments. Both authors are directors of PFMConnect, a public financial management consultancy (john.leonardo@pfmconnect.com).


Coherent Policy, Planning, and Performance for Delivering the SDGs

 Posted by David Fellows[1]                

This is an extraordinarily important time for coherent policy, planning, and performance – the “3 Ps” – for delivering the SDGs and other core public policy objectives.

The SDGs present an extensive range of essential service improvements that are applicable across the world. The threat posed by climate change has become a major international issue with immensely ambitious remedial targets and huge spending requirements. Governments are also under pressure to introduce gender responsive budgeting and digitalize their public finances, reforms that offer huge benefits but also challenges and costs in the short to medium-term. At the same time, the Covid-19 pandemic has devastated many economies and produced huge fiscal burdens, increasing the challenge of delivering the SDGs and better environmental outcomes.

A coherent delivery framework

It is important that governments take decisions within a strategic framework that represents an appropriate timeframe and deals clearly with policy goals, service responses, resources deployed, and outcomes achieved. The various elements of this framework include:

  1. A vision having a 10-year perspective expressed in terms of outcomes.
  2. Objectives set with a 3-5 year delivery time frame, consistent with achieving the vision.
  3. Delivery targets for each of the next 3-5 years in terms of service outputs relevant to the performance outcomes.
  4. 3-5 year budgets for agencies or programs that reflect the delivery outcomes and performance targets that each budget represents.
  5. Annual accounts that set out executive responsibilities, annual performance outcome and delivery targets and the actual performance achieved.
  6. Training and recruitment plans that enable public agencies to operate the systems and deliver the services that have been approved.

Delivering change

Successful reform is an elusive concept. Any initiative worth doing must have a benefits realisation plan specifying the steps necessary to ensure that progress is being made and that the end results are achieved.

Services and changes to service provision should be protected by risk management strategies that seek to mitigate internal or external events and shocks that may otherwise hamper delivery or destroy valuable assets.

Review and accountability

The various elements of the framework must be consistent with each other. When major new commitments are proposed, or it becomes obvious that major targets are no longer achievable then a review of the framework should be undertaken. In addition, there should be an annual review of the framework as part of the annual budget preparation process, perhaps as part of a wider spending review. Policies, plans, performance, and the results of review processes should be made public. There is no aspect of the planning and delivery process that cannot benefit from public scrutiny and comment. It is the responsibility of all public institutions in a democratic country to make themselves open and responsive to such a dialogue.

The PFM challenge for developing countries

Text Box: A = High level of performance that meets international practice                                               B = Sound performance in line with many elements of good international practice                                C = Basic level of performance           D = Less than basic level of performance or insufficient information to score
The chart relates to 58 countries: 52 developing countries and 6 countries in transition

The relatively poor condition of PFM in developing countries shown in the chart suggests the difficulties that developing countries face in planning, managing, and maintaining their existing budget systems. The SDGs and other global pressures to increase spending represent additional challenges for PFM systems to face. Multilateral decisions on the SDGs and climate change must therefore take account of the consequences for developing nations given the likely dependence of successful outcomes on their cooperation.

Conclusion

The immense pressures on governments worldwide to fulfil the global obligations and pressures described above often require concerted action. If governments are to succeed without making over-extended commitments, wasting time and money on impractical solutions, they must make decisions within the rigours of a fully operational policy, planning, and performance framework. Multilateral agreements, economic, social and technological considerations will all feed into framework construction but the integrity of the framework is key.

Framework development will inevitably present hard choices but that is a strength of the process. It should also provide a coherent basis for democratic accountability if, as a result, drastic life changes are required, freedoms are curtailed, and personal costs are increased.

This article was first published by the International Monetary Fund’s Public Financial Management Blog on 20 September 2021.


[1] David Fellows began his career in UK local government where he became President of the Society of Municipal Treasurers and a pioneer of digital government. He followed this with appointments in the UK Cabinet Office and the National Treasury of South Africa. He is a Director of PFMConnect.


Public financial management weaknesses can lead to corruption

Mauritania’s experience

Global corruption trends

Two recent reports on Global corruption trends highlight a number of states facing serious challenges and our analysis indicates some interesting links between corruption and standards of public financial management.

Transparency International’s recently released 2016 Corruption Perceptions Index for 2016 indicates that Mauritania’s ranking deteriorated noticeably in 2016 compared to the previous year. The full data set for all 176 countries  is available here and the Mauritanian data is shown at Figure 1.

Figure 1: Transparency International Corruption Perceptions Index Mauritania results 2015-2016

The World Economic Forum’s 2016 Global Competitiveness Survey, released on 15 September 2016, included the results of their annual Executive Opinion Survey which aims to measure critical concepts affecting the business environment such as the incidence of corruption. This survey shows that Mauritania was ranked 124th out of the 138 countries for corruption. The World Economic Forum’s 2016 Global Competitiveness Survey report is available here.

We have developed a spreadsheet showing (i) the country rankings for the World Economic Forum’s Executive Opinion Survey (not publicly available) and reported corruption impediment scores and (ii) a comparison of the Transparency International and World Economic Forum survey results that are available for 125 countries. Contact us if you would like to receive a copy of our spreadsheet.

We have  found that there is a significant overall negative correlation between the scores in the two surveys (a Pearson coefficient of -.78).

Mauritania’s poor PFM and poor corruption performance

Mauritania’s corruption rankings in both surveys are relatively poor with scores falling in the bottom 20% of the two surveys. Many developing countries, including Mauritania, face significant challenges in addressing corruption. We have previously identified a wide range of actions that governments (as well as the private sector) could take to assist in reducing corruption levels that include improving a range of public financial management practices in our blog International Development and the Challenge of Public Sector Corruption.

Last year we examined the Public Expenditure and Financial Accountability (PEFA) results of the twenty-four countries, including Mauritania,that published PEFA assessments during 2013-2015. Nine of the twenty-four countries studied, including Mauritania, had PEFA results indicating relatively weak public financial management; Mauritania was ranked 19th out of the twenty-four countries studied using a scoring system that the IMF has previously employed. Mauritania recorded relatively poor scores in a number of key PFM activities that are important in reducing corruption including payroll controls, internal audit, financial reporting and external audit; details are shown at Figure 2; this chart can be viewed in more detail here.

Figure 2: Mauritania PEFA indicators’ relative performance

Seventeen of the above-mentioned twenty-four countries feature in Transparency International’s 2016 Corruption Perceptions Index.  Sixteen countries (Ghana is the exception) recorded below –average scores in TI’s 2015 and 2016 surveys; details of the 2015 and 2016 scores and the percentage change between these periods are presented in Table 1.

Table 1: TI 2015-2016 scores for 2013-2015 PEFA assessment countries

PEFA score TI 2016 score TI 2015 score % change in 2015-2016 scores
Armenia 60 33 35 -5.71%
Azerbaijan 61.5 30 29 3.45%
Belarus 49 40 32 25.00%
Bosnia & Herzegovina 50 39 38 2.63%
Burkina Faso 58.5 42 38 10.53%
Congo Republic 21 20 23 -13.04%
Gambia 32 26 28 -7.14%
Ghana 27.5 43 47 -8.51%
Guinea-Bassau 14.5 16 17 -5.88%
Kyrgyz Republic 49.5 28 28 0.00%
Macedonia 44.5 37 42 -11.90%
Madagascar 25.5 26 28 -7.14%
Mauritania 26.5 27 31 -12.90%
Mongolia 42 38 39 -2.56%
Nepal 50.5 29 27 7.41%
Papua New Guinea 21.5 28 25 12.00%
Timor-Leste 36 35 28 25.00%

With ten of the seventeen countries in Table 1 recording either no change or a deterioration in their scores in 2016 (including Mauritania), the negative Pearson correlation between overall 2013-2015 PEFA scores and TI corruption scores for these countries strengthened from -0.41 in 2015 to -0.56 in 2016 pointing to the possible impact that poor PFM may have in facilitating corruption in the public (and private) sectors.

The World Bank noted in November 2016 that “Mauritania’s PFM system remains weak”. If countries, such as Mauritania, employ robust anti-corruption strategies, including actions to address key PFM weaknesses currently influencing corruption levels, they may in time be able to make some progress in curbing corruption.

Need to resolve a public financial management problem? Inquire now to schedule an initial online meeting.


International Development and the Challenge of Public Sector Corruption

By David Fellows, John Leonardo and Cornelia Körtl[1]

10_-_hands_shaking_with_euro_bank_notes_inside_handshake_-_royalty_free,_without_copyright,_public_domain_photo_image_01

Revelations in the Panama Papers released earlier this month have focused international attention on the hidden financial structures that facilitate the transfer of assets obtained through both legal and criminal means to offshore tax havens. In a recent report, the research organization Global Financial Integrity suggests that illicit financial flows from developing countries have reached the staggering sum of $1 trillion a year.

Is corruption in developing countries of any legitimate concern to the West? The U.N. Economic Commission for Africa in its recent African Governance Report IV implicates the West when it suggests that “the role of private sector actors in fuelling corruption … should not be ignored.” Yet Western nations are increasingly expected to act as trading partners to developing countries. They must also be accountable to their electorates for obtaining value from their aid expenditure.

Corruption concerns the use of public position to gain private advantage, such as wealth, power, or status. In the public sector, corruption can take on many forms, ranging from the misappropriation of funds to extortion and the abuse of patronage. We provide further examples here. It can reduce state revenues, increase state expenditures, diminish economic development, and impair the capacity of public services. It can also hamper the transition from aid as project-funding to aid as direct budget support. Corruption can undermine nationhood by destroying confidence in public administration and the political process, impoverishing communities and denying opportunity.

At the most recent OECD’s Anti-Bribery Ministerial Meeting, the president of the International Federation of Accountants stressed the importance of strengthening public financial management (PFM) systems to combat corruption in the public sector. PFM includes budget preparation, internal control, internal audit, procurement, monitoring and reporting arrangements, and external audit[2].

In this short piece we offer evidence that corruption hampers government effectiveness, including the quality of public services, and economic prosperity. While serious corruption exists in both developed and developing countries, it is developing countries that can least afford the very significant cost and the collateral damage. We suggest that good PFM can help control corruption and we set out our thoughts on how this beneficial effect can be achieved.

Two sides to corruption

Worryingly, networks of corruption can normalize corrupt behaviour and offer mutual protection to those involved. In an insightful report on Indonesia in 2003[3] the World Bank stresses the importance of organisational environment over salary level and suggests that political corruption usually requires the active complicity of civil servants. The international Anti-Corruption Resource Centre, U4, has developed a useful account of the personal and social considerations in play. For instance, the risk of detection and consequent penalties can be equally relevant considerations: when the risk of detection is low, corruption may thrive even in situations with significant penalties. Contrarily, corruption may be high with high risk of detection but low penalties. Similarly, Khan[4] argues that the underlying distribution of power between actors is essential to understand corruption in a particular context. Clearly, anti-corruption reforms must address the specific drivers of corruption in the national context.

Various international agencies have sought to discourage the provision of bribes by foreign nationals. The UN Convention against Corruption  attempts to discourage corruption by making the payment of bribes abroad a criminal offense prosecutable in the home countries of foreign nationals. The OECD Anti-Bribery Convention takes a similar approach.

The empirical connection 

We have examined the consequences of corruption and the impact on PFM performance from a statistical perspective in several ways. We summarise our conclusions in this section (all correlations are significant at a 99% confidence level except where otherwise stated). We also illustrate here the chain of events implicit in the data.

Firstly, we have correlated control of corruption (capturing perceptions of the extent to which public power is exercised for private gain) and government effectiveness (including the quality of public services) for 184 countries using data from the World Bank’s 2013 Worldwide Governance Indicators, together with World Bank 2013 per capita income data and Rand Corporation’s Trace (bribery) Matrix risk scores for these countries (see Table 1).

Table 1: Corruption Correlations
Corruption measure WGI Government Effectiveness GDP/head
WGI Control of Corruption Significant correlation Significant correlation
Trace (bribery) Matrix[5] Significant inverse correlation Significant inverse correlation

Indicators of corruption are highly subjective and therefore of questionable validity. Nevertheless we note the similarity of the significant relationships achieved from the two different indicators of corruption and hence believe in the validity of the relationships.

We also correlated some recent measures of PFM performance with measures of corruption and government effectiveness for 39 developing countries for which Public Expenditure and Financial Accountability (PEFA) assessments[6] were made available during the past three years from 2013 to 2015 (see Table 2).

This second set of correlations is more problematic. PEFA indicators are not designed to isolate activities that are most indicative of corruption and recent PEFA results together with government effectiveness, control of corruption and Trace risk scores were only available for thirty-nine countries. Despite this hindrance and the inherent weakness in the corruption data mentioned above we find some significant statistical relationships amongst the indicators that cover activities most vulnerable to corruption or concerned with its detection. This seems to suggest that PFM, or at least some aspects of PFM, is relevant to combatting corruption and securing government effectiveness.

Table 2: PFM Correlations to Corruption and Government Effectiveness
PFM quality assessed using PEFA Performance Indicators Control of Corruption Trace Risk  Index Government Effectiveness
Degree of integration & reconciliation between personal records and payroll data Significant Correlation No significant correlation Significant Correlation
Effectiveness of internal controls for non-salaried expenditure No significant correlation Significant Correlation Significant Correlation
Frequency and distribution of internal audit reports Significant correlation* Significant Correlation Significant Correlation

*This correlation is significant at a 95% confidence interval.

The general inference we take from this exercise is that good PFM practice is likely to be beneficial to the advancement of good public service delivery and economic performance in developing countries.

Effective PFM reforms to combat corruption

Endemic corruption should be confronted through location-specific action prioritized on three factors: national detriment, effectiveness of the measures proposed, and capacity of the administration to effect the proposals.

Reform proposals should be designed to cover key weaknesses but avoid technical complexity that cannot be sustained. For instance, does the state have a sufficiently robust communications network and the necessary information and communications technology skills available to enable public sector organisations to undertake their purchasing from private sector suppliers using internet-based systems; or, are manual system improvements coupled with greater transparency in awarding contracts preferable, at least in the short term? Next, financial regulations need to be coherent and simplified where necessary. They should be more exacting in areas of high risk and high value.

Internal audit often requires improved capacity and must have reporting access to the most senior government official. External audit reports should have full public disclosure and external auditors should have access to public accounts committees that are informed by independent expert support.

The public must be made aware of the service standards they can expect and have access to effective complaints mechanisms in order to ensure value for money. Also, business and professional associations must be encouraged to voice concerns about corruption and poor financial practices.

Transparency of policy decisions and of financial performance is imperative through government information systems, among which government websites are increasingly important. But free media reporting and comment are essential to securing all such reforms.

Wider supportive activities

Perhaps some of the most important PFM reform activities are not of a strictly financial nature. Senior officials and politicians must demonstrate exemplary leadership, civil service watchdogs should underpin standards of conduct and should be invested with investigatory powers, codes of conduct should be adopted as a condition of employment, recruitment must be made on merit, appraisal and disciplinary processes must be robust, and there must be adequate standards of induction and in-service training.

Judicial systems must be freed from corruption and political interference, and consideration should be given to establishing special courts for corruption.

Opportunities for corruption can be reduced by avoiding personal contact through the use of online service delivery (where feasible) and by eliminating unnecessary bureaucracy. Transferring services of a commercial nature from public to private sector providers should be considered, although this requires careful implementation and continuing regulation in some cases.

The role of development partners

International development partners, particularly the large aid organizations, are well positioned to establish appropriate incentive frameworks, identify opportunities, and adopt the necessary long-term perspective required for PFM reforms. These situations are not suitable for pre-packaged solutions. Rather, the frameworks should include actively managed, locally focused programs requiring collaboration between governments and development partners to track progress and drive change, with ownership of the programs vested in client states.

Development partner funding for reform activities should be linked to the attainment of specific milestones previously agreed with governments and released in tranches as agreed reforms are realized. Such improvements are beginning to gain ground and must be complemented by effective advocacy for transparency in financial matters and press freedom.

Conclusion

The level of corruption in developing countries, including the use of tax havens for sheltering the proceeds of top tier corruption, has become a current issue. In addition, corrupt environments threaten trade relations with developing countries and the criminalization of bribery in the home countries of foreign nationals, although an essential development, adds to the deterrent effect for foreign-based businesses.

Economist Gabriel Zucman estimates that over 30 percent of all Africa’s financial wealth is stored in tax havens, of which it may be assumed that a substantial proportion goes untaxed. The conclusion drawn from this is that even if the poor pay their fair share in taxes, the world’s wealthiest often do not. Reforms of tax law and administration are clearly required as part of the PFM reform agenda.

The eradication of endemic corruption is an enormous challenge for developing countries. PFM reform has much to offer, but international development partners need to do more to support collaborative change processes and plan for the long haul.

[1] David Fellows and John Leonardo are Principals and Cornelia Körtl is an Associate of PFMConnect. Their work covers development projects in Africa, Asia, and the Pacific Islands.

[2] A wide-ranging discussion of PFM practice is well beyond the confines of this article. We refer only to practices that are particularly relevant to the control of corruption. See Stephen Peterson ‘Public Finance and Economic Growth in Developing Countries: Lessons from Ethiopia’s reforms’ for a thought-provoking and very readable commentary on the challenges facing those who would design financial systems for developing countries.

[3] World Bank: Combating Corruption in Indonesia Enhancing Accountability for Development 2003

[4] Mushtaq Khan understands corruption as a ‘type of illegal rent seeking’ (Khan, 2006. State weakness in developing countries and strategies of institutional reform – Operational Implications for Anti-Corruption Policy and A case-study of Tanzania, p.9). For a complete understanding of his theory on rent-seeking see Khan, M. and Jomo, K.S. (eds) (2000). Rents, Rent-Seeking and Economic Development: Theory and Evidence in Asia. Cambridge: Cambridge University Press.

[5] The Trace Matrix assesses the risk of encountering business bribery in a particular country; higher scores imply higher risk of encountering bribery expectations (for more information see here).  A discussion of the methodology employed to determine the correlations presented in Tables 1 (and 2) is available here.

[6] For the PEFA system and its findings see www.pefa.org