Getting the PFM basics right (A study of PEFA scores awarded over the 2016 and 2011 Frameworks)

By David Fellows and John Leonardo

Introduction

The Public Expenditure and Financial Accountability (PEFA) programme provides a framework for assessing and reporting the strengths and weaknesses of public financial management (PFM). The current 2016 Framework refines the previous 2011 Framework and is structured under a hierarchy of 6 Pillars, 31 Indicators (PIs) and 94 Dimensions. The PEFA Field Guide explains the components of the 2016 Framework and describes how an assessment team should score each dimension on a scale of A to D, a D score representing the lowest level of performance.

An initial assessment of the latest PEFA reports for countries published under the 2016 Framework suggested that many countries were not getting the PFM basics right. This led to a comparison of recent results with those from earlier PEFA reports prepared under the 2011 Framework to examine performance over time and the lessons for PFM improvement that such a comparison may offer (termed the ‘dual study’). It was decided to focus on dimension scores since the demands of PFM can change markedly depending on the aspects of the subject matter under consideration and the evident variations of score for the same country at dimension level within a range of PIs.

It was decided to confine this initial study to the analysis of D scores at the dimension level given the frequency of D scores, the very poor performance they represent and the importance of raising performance to a higher level. The Field Guide requires a D score when: ‘the feature being measured is present at less than the basic level of performance or is absent altogether, or that there is insufficient information to score the dimension’.

For the purpose of this study, D scores include dimensions marked D*, NR and some NA scores where evidence suggests a breakdown in PFM activity. It seemed evident that these attributions are often applied inconsistently and serve to obscure the extent of the poor performance of some countries by avoiding the use of justifiable D scores. A summary of all scores for the 2016 Framework and the dual study evaluations, as discussed in this report, can be accessed at Annex 1.

2016 Framework analysis

The 2016 Framework analysis consisted of the latest published evaluations for the 63 countries for which there were published reports at the time of this study. The D scores represent 32% of all dimension scores in this data set, 39% amongst low-income countries.

D scores were widely distributed throughout the framework with 45 of the 94 dimensions having an above average number of D scores.

The study also defined and assessed the key factors (termed descriptors) that contributed to PFM performance. The results, summarised at  Annex 2, suggested that most D scores can be explained by the absence of ‘Management Effectiveness’, ‘Integrity’ and in one case of ‘High Level Technical Knowledge’ although poor “System Design” was another potentially important contributing factor.

Annex 3 provides a full list of the 2016 Framework dimensions and D score data together with the descriptors contributing to each dimension.

Dual framework

Following the results of the 2016 Framework D score study it was decided to undertake a review of 45 countries that have undertaken at least one PEFA evaluation under both the 2011 and 2016 frameworks (the earliest and the latest studies we used for countries with more than two studies). This enabled a country’s performance to be compared over a five-year period.

The 2011 and 2016 PEFA frameworks differ in many respects. An equivalence table published by PEFA suggests that the two frameworks can be aligned to 37 “equivalent” dimensions on the basis that the respective dimensions were either “directly comparable” or “indirectly comparable”.

The PEFA equivalence table identifies 28 dimensions (or in some cases subsets) from the 2011 framework as “non-comparable (subject only)” to 2016 counterparts suggesting that the dimension descriptions and scoring routines differ markedly while the general area of relevance to the dimensions are similar. This leaves only 37 pairs of comparable dimensions.

On examination, the study team decided that 26 of the 28 pairs of dimensions judged “non-comparable (subject only)” were in fact very similar to the 2016 counterparts, the main difference being the way in which the later guidance is translated into clear-cut scoring criteria but that a good PEFA evaluator should have made reasonably similar judgements for both frameworks when reviewing all but two of these dimensions.

This exercise, therefore, recognises 63 equivalent dimensions while also providing results for PEFA’s 37 equivalent dimensions. It is suggested that the D score characteristics of both data sets are sufficiently similar to provide a reasonable validation for the larger 63 dimension equivalence thereby extending the usefulness of inter-framework comparisons. Details of the PEFA and PFMConnect equivalence tables are set out at Annex 4. The dual study of 2016 and 2011 Framework with D score data at dimension level is set out at  Annex 5.             

The dual study is highly concerning in terms of the lack of improvement amongst those dimensions receiving D scores. These data are further summarised and commented on below.
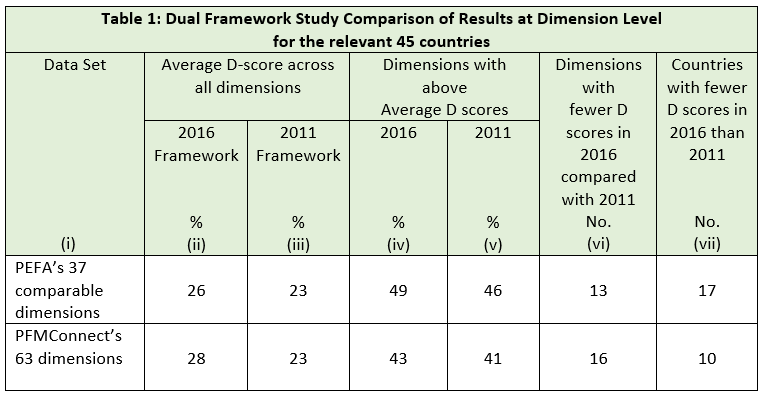
The dual framework study reveals a deteriorating performance with most dimensions exhibiting a greater number of D scores in the later evaluations. Only 13 (35%) of dimensions from the 37 dimensions study and 16 (25%) from the 63 dimensions study experienced reductions in D scores between evaluations.

When the dual evaluations for the same country were compared, see Annex 6, it was noted that most countries recorded a higher proportion of D scores for the same dimension in both evaluations demonstrating a reasonably consistent poor performance. A few countries displayed less consistent results.

Few countries in the 63 dimensions set recorded reductions in the number of D scores in 2016 framework results compared with the 2011 framework results. The top performers where significant PFM reform activities had been undertaken between the dual framework studies included: Philippines, Maldives, Mongolia and Tajikistan.
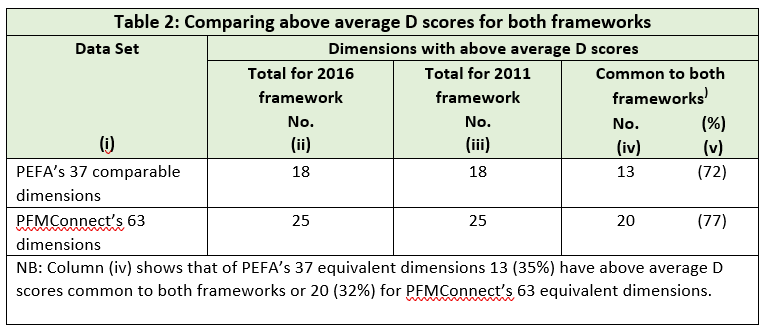
The results for the proportion of dimensions with above-average D scores that are common to both framework dimensions sets is concerning. Approximately one third of all dimensions had above-average D scores that were common to both frameworks for the same country for both datasets. In addition, over 70% of the above-average dimensions in both datasets were common to both frameworks showing limited improvement in the worst scoring areas over a five-year period.

Dimensions with regular poor performance are widely distributed (titles in red at Annex 6). This suggests pockets of poor management that remain in place without effective challenge and this is consistent with the descriptor analysis.

Conclusions

This study offers a range of findings that pose questions about the approach, effectiveness and sustainability of PFM reforms instituted by national and subnational governments often in collaboration with development agencies. The concerns about management effectiveness and integrity highlighted in this study must be seen to question the most basic aspects of any organisation.

The study focusses on D score analysis, but it could be useful to extend the analysis to C-level scores where the performance of countries still remains below good international standards. This could reveal new characteristics of national PFM performance and extend the range of analytical techniques applied to performance data.

The data analysis evidences the credibility of PFMConnect’s extended 63 dimension equivalence model that offers significant potential for more detailed studies of specific countries or regions.

Further work on descriptors to reveal contributory factors to variations in performance seems worthy of further development.

The failure of some governments to publish PEFA studies in full reinforces concerns about the need for greater attention to integrity. Another improvement that could be readily and widely implemented is legislative scrutiny of audit reports (PI 31).

Recommendations

We recommend that country-specific studies should be undertaken based on PEFA assessment reports (both 2016 Framework studies for the full 94 dimensions and dual studies where the data are available) examining D scores at dimension level to establish potential causes of poor performance and identify ways in which performance may be improved. Issues to consider with respect to areas of poor performance, include:

  • The commitment to personnel development and support, including: in-service training, management development, oversight, feedback on performance, and system design.
  • The adequacy of transparency and accountability and evidence of corrupt activity.
  • The quality of relevant communication and support levels among different departments and units of the finance ministry.
  • The reasons for persistently poor or erratic performance and the fit with other findings.
  • The observations of managers and staff on reasons for poor performance and barriers to improvement.

We recommend that country studies should be designed as the initial phase of PFM development programmes. In this context, a report by the Swedish International Development Cooperation Agency (SIDA) offers some observations about the conditions for effective PFM reform. These include the importance of change agendas being aligned with Government priorities and the need to treat PFM reform as a learning process with strong emphasis on coordination and systematic evaluation of the activities performed by teams responsible for delivery.

Groups of countries or subnational bodies may wish to collaborate in reform programmes enabling challenges and learning to be shared and systems of mutual support developed. We have previously advocated the use of digital communication as a cost-effective and time-saving way of sharing knowledge and ideas between nations (incl. expert advisors).

Any country, region or development institution wishing to participate in further work in this field is invited to discuss their interest with the authors.

An article based on this study has been published by the IMF’s PFM Blog.

PFMConnect is a public financial management consultancy with a particular interest in the use of digital communication to support learning and sharing expertise amongst the international development community.

David Fellows began his career in UK local government where he became President of the Society of Municipal Treasurers and a pioneer of digital government. He has held appointments in the UK Cabinet Office and the National Treasury of South Africa (david.fellows@pfmconnect.com).

John Leonardo is a PFM expert with extensive worldwide experience. He has undertaken PFM assignments in Africa, Asia, the Caribbean and the Pacific where he undertook PEFA assessments. Both authors are directors of PFMConnect, a public financial management consultancy (john.leonardo@pfmconnect.com).


Digital Government in Developing Countries

Posted by David Fellows and Glyn Evans[1]

With the aid of development partners, developing countries are making commitments to maximise the use of digital technology. The ICT industry is right behind them. In these reforms, digital technology is being represented as the principal transformative medium of government. But to think of “Digital Government” as necessarily transformative, almost an end in itself, is misguided. Governments should be primarily concerned to provide their services and engage with electorates in the most cost-effective way. Digital technology may or may not have a role in that process.

Here are some of the fields in which digital technology has demonstrated that it has a potential role to play in developing countries:

  • Transparency and public engagement
  • Basic public service delivery in the fields of health and education
  • Public safety and security
  • The collection of tax and non-tax revenues
  • The management of population growth in urban areas
  • The sustainability and development of rural communities
  • Skill shortages throughout the economy
  • Economic diversification
  • Measures to combat corruption
  • Resilience to natural disasters

We do not accept, however, that the answer to any of these challenges is necessarily a massive investment in digital technology, say a ‘digital city’ or a fully integrated expenditure, revenues and payments system.

Many developing countries are not well positioned to make sustainable progress with digital technology in huge multi-faceted programmes requiring vast initial expenditure. This form of development may do little more than provide substantial fee income for international consultancies and software developers. Once the consultants are gone and system design faults surface, client needs change or in-house staff are poached by others, then the facilities that promised so much may become more of a hindrance than an advantage.

Things may not even get that far. Without governments having sufficient staff with the necessary technical skills, digital systems may never be properly configured and the client may be left with a partially implemented system. Nevertheless, it is surprising how many such projects are specified and funded. Problematic factors are sometimes acknowledged without being fully taken into account.

We suggest that an evolutionary approach to digitally-enabled reform offers a more realistic way forward. The process should start with an analysis of the operational imperatives for improvement. This requires the following ten-point strategy:

  1. A clear vision for future service delivery and the developing relationship between citizens and the government
  2. A thorough assessment of internal resources (skills, knowledge, staffing commitments and budgets) required to support the implementation of reform and new ways of working
  3. An overhaul of management philosophy and governance arrangements
  4. The identification of mechanisms to address relevant gaps in capacity including improvements in the recruitment and training of in-house staff and encouragement of local firms to upgrade their ICT capacity incrementally to support public service digital applications (multinational collaboration for the professional development of public servants and the improvement of governance and working practices are addressed in previous blogs)
  5. An examination of the various options by which change can be achieved
  6. A robust approach to investment appraisal
  7. An assertion of priorities based on sound information and analysis
  8. A clear strategy to deliver project sustainability (including security)
  9. The identification of the benefits sought and how such benefits are to be achieved, and
  10. A relentless focus on benefits realization accompanied by the modification of working methods to rectify performance shortfalls.

This approach is based on our past work, which we can illustrate with examples of two completed major projects, as well as our experience in developing countries.

The first example in Knowsley, one of the UK’s most deprived areas, was one of the world’s first “smart city” projects, started in 1997. It featured public information systems, electronic application forms, payment facilities, public feedback on quality of service, schoolwork support, an interactive liveability learning application for mentally challenged young adults, digital enablement schemes and public availability of PCs in libraries and community centres.

The second project in Birmingham, the UK’s largest metropolitan municipality was probably the largest digitally-enabled change programme ever undertaken in a European city. It included the digitisation of procurement, HR (including performance management) and accounting practices, providing managers with accurate, real-time information, and digitising customer contact and the fulfilment management of customer requests, resulting in customer satisfaction improving by 20 percentage points. The entire change programme realised revenue savings of £100 million a year.

These examples suggest that it is possible to make significant reductions in the risk to both funders and recipients of digital-enabled developments by:

  • Preparing an organisational readiness analysis and development strategy as set out above
  • Establishing the necessary roles and finding the right people to fill those roles
  • Monitoring and evaluating progress, and
  • Responding with operational modifications as necessary to achieve the desired outcomes, and as technological advances offer fresh opportunities.

Some developments will not necessarily require state financial or operational support. Private sector encouragement may be sufficient. For example, physical planning that offers confidence to developers or infrastructure standards that support the public use of digital technology.

In our view, a challenging reform agenda demands a flexible approach, cool judgement and realistic timescales. Those in positions of responsibility should take steps to avoid being found friendless and trapped by the expectations and largesse heaped upon them.

[1] David Fellows is a director of PFMConnect Ltd, a management consultancy specialising in financial, digital and engineering services for developing countries. He is a winner of the Swedish Prize for Democratic Digital Service Delivery. Glyn Evans is the Vice President of the Major Cities of Europe IT Users Group and former CIO of various major cities.


Developing Systems to Combat Corruption

Posted by David Fellows[1]

Introducing the concept of “objective data”

In March 2018, we republished a short note on the use of objective data to combat corruption [2]. The piece highlighted statistical techniques being used in western countries to identify corruption by correlating unorthodox procurement practices with aberrant supplier behaviour established from factually based ‘objective’ administrative data. It was suggested that less complex approaches to the analysis of ‘objective’ data could be used to indicate the need for further forensic examination of officials, suppliers, and politicians. The emphasis was on finding workable approaches for developing countries that were compatible with the available resources.

The term ‘objective’ data refers to factual information derived from official government records. It represents data on transactions, activity schedules, and personal information, recorded through established processes, that give the information credibility. This contrasts with ‘subjective’ data which is often based on opinions or experience that is poorly evidenced and of limited application, as is the case with corruption perception surveys.

Frequent use of objective data

Objective data is checked and compared in dozens of administrative processes which can produce anomalies that may indicate the presence of corruption. For example, invoices are checked against orders and goods received notes or contract certificates, or payroll submissions are checked against timesheets. In addition, national bodies charged with the oversight of public administration – such as supreme audit institutions and public procurement commissions – are routinely engaged in the examination of objective data which can also lead to the identification of corruption.

Such findings are then included in published reports that may be used to identify process deficiencies or potentially to prosecute cases of fraud and corruption. These oversight functions can be particularly effective when they are invested with independence from government, extensive powers of enquiry, transparency of reporting, and due consideration of findings.

Developing objective administrative data systems

Apart from routine scrutiny provided by administrative processes and oversight arrangements, programs of administrative reform provide excellent opportunities for the development of systems that incorporate the automatic validation and cross-referencing of administrative data to help identify patterns of corrupt activity.

Such arrangements are straightforward, well known, and remarkably simple to put into effect but in practice they are rarely complete or well executed. Too often there is a lack of expectation that good administration will have a beneficial effect. This places a premium on those who hold relevant managerial roles, requiring them to value high standards of administrative practice; exercise oversight responsibilities courageously, insightfully and in partnership with others as necessary; and ensure that reform opportunities are used to best effect. Well prepared and committed management is a prerequisite to any well-intentioned anti-corruption initiative.

Objective administrative data applications

Some examples of objective administrative data and its use to combat corruption are included in an Appendix available here.

The use of objective data could also be developed in other ways. For example:

  1. Countries could prepare anti-corruption strategies that include the use and development of objective data and staff training. Such strategies should be accompanied by operational guidance. Anti-corruption strategies and related material are often referred to as being part of the standard anti-corruption armoury but are rarely made available. In practice, however, few of these documents have been produced to a reasonable standard anywhere in the developing world, and perhaps it is time to redress this omission.
  2. Additionally, collaboration between states, perhaps on a regional basis, could be helpful in developing techniques for interrogating data, preparing anti-corruption strategies, sharing knowledge of corrupt practices, and building operational cooperation between countries
  3. Consideration should also be given by multilateral agencies and regional representative bodies to the development of an international systems assessment schema (akin to PEFA methodology[3]) that would indicate the efficacy and shortcomings of individual administrative systems for the purposes of combatting corruption.

This article is written with government administration in mind, but similar considerations apply to local governments and state-owned enterprises.


[1] Director, PFMConnect. The author thanks John Leonardo for his helpful comments.

[2] This blog was first published at http://blog-pfm.imf.org/pfmblog/2018/03/how-useful-are-perception-indices-of-corruption-to-developing-countries.html

[3] See https://pefa.org/sites/default/files/PEFA%20Framework_English.pdf


Forthcoming blog: Developing Systems to Combat Corruption

In a March 2018 blog PFMConnect co-principal David Fellows discussed the deficiencies surrounding corruption perception indices and outlined how objective data analysis could offer a clearer insight into the systemic nature of corrupt behaviour, thus providing a more precise indication of the corrupt parts of an administration, the number of external parties that are engaged in corruption, and features of the public financial management (PFM) system that need to be strengthened in order to combat corruption.

In a forthcoming blog “Developing Systems to Combat Corruption”, David describes how an objective data system is used in practice and how the concept may be developed. Some further examples of objective data and their use to combat corruption is available here.