By David Fellows, John Leonardo and Cornelia Körtl[1]

Revelations in the Panama Papers released earlier this month have focused international attention on the hidden financial structures that facilitate the transfer of assets obtained through both legal and criminal means to offshore tax havens. In a recent report, the research organization Global Financial Integrity suggests that illicit financial flows from developing countries have reached the staggering sum of $1 trillion a year.
Is corruption in developing countries of any legitimate concern to the West? The U.N. Economic Commission for Africa in its recent African Governance Report IV implicates the West when it suggests that “the role of private sector actors in fuelling corruption … should not be ignored.” Yet Western nations are increasingly expected to act as trading partners to developing countries. They must also be accountable to their electorates for obtaining value from their aid expenditure.
Corruption concerns the use of public position to gain private advantage, such as wealth, power, or status. In the public sector, corruption can take on many forms, ranging from the misappropriation of funds to extortion and the abuse of patronage. We provide further examples here. It can reduce state revenues, increase state expenditures, diminish economic development, and impair the capacity of public services. It can also hamper the transition from aid as project-funding to aid as direct budget support. Corruption can undermine nationhood by destroying confidence in public administration and the political process, impoverishing communities and denying opportunity.
At the most recent OECD’s Anti-Bribery Ministerial Meeting, the president of the International Federation of Accountants stressed the importance of strengthening public financial management (PFM) systems to combat corruption in the public sector. PFM includes budget preparation, internal control, internal audit, procurement, monitoring and reporting arrangements, and external audit[2].
In this short piece we offer evidence that corruption hampers government effectiveness, including the quality of public services, and economic prosperity. While serious corruption exists in both developed and developing countries, it is developing countries that can least afford the very significant cost and the collateral damage. We suggest that good PFM can help control corruption and we set out our thoughts on how this beneficial effect can be achieved.
Two sides to corruption
Worryingly, networks of corruption can normalize corrupt behaviour and offer mutual protection to those involved. In an insightful report on Indonesia in 2003[3] the World Bank stresses the importance of organisational environment over salary level and suggests that political corruption usually requires the active complicity of civil servants. The international Anti-Corruption Resource Centre, U4, has developed a useful account of the personal and social considerations in play. For instance, the risk of detection and consequent penalties can be equally relevant considerations: when the risk of detection is low, corruption may thrive even in situations with significant penalties. Contrarily, corruption may be high with high risk of detection but low penalties. Similarly, Khan[4] argues that the underlying distribution of power between actors is essential to understand corruption in a particular context. Clearly, anti-corruption reforms must address the specific drivers of corruption in the national context.
Various international agencies have sought to discourage the provision of bribes by foreign nationals. The UN Convention against Corruption attempts to discourage corruption by making the payment of bribes abroad a criminal offense prosecutable in the home countries of foreign nationals. The OECD Anti-Bribery Convention takes a similar approach.
The empirical connection
We have examined the consequences of corruption and the impact on PFM performance from a statistical perspective in several ways. We summarise our conclusions in this section (all correlations are significant at a 99% confidence level except where otherwise stated). We also illustrate here the chain of events implicit in the data.
Firstly, we have correlated control of corruption (capturing perceptions of the extent to which public power is exercised for private gain) and government effectiveness (including the quality of public services) for 184 countries using data from the World Bank’s 2013 Worldwide Governance Indicators, together with World Bank 2013 per capita income data and Rand Corporation’s Trace (bribery) Matrix risk scores for these countries (see Table 1).
| Table 1: Corruption Correlations |
| Corruption measure |
WGI Government Effectiveness |
GDP/head |
| WGI Control of Corruption |
Significant correlation |
Significant correlation |
| Trace (bribery) Matrix[5] |
Significant inverse correlation |
Significant inverse correlation |
Indicators of corruption are highly subjective and therefore of questionable validity. Nevertheless we note the similarity of the significant relationships achieved from the two different indicators of corruption and hence believe in the validity of the relationships.
We also correlated some recent measures of PFM performance with measures of corruption and government effectiveness for 39 developing countries for which Public Expenditure and Financial Accountability (PEFA) assessments[6] were made available during the past three years from 2013 to 2015 (see Table 2).
This second set of correlations is more problematic. PEFA indicators are not designed to isolate activities that are most indicative of corruption and recent PEFA results together with government effectiveness, control of corruption and Trace risk scores were only available for thirty-nine countries. Despite this hindrance and the inherent weakness in the corruption data mentioned above we find some significant statistical relationships amongst the indicators that cover activities most vulnerable to corruption or concerned with its detection. This seems to suggest that PFM, or at least some aspects of PFM, is relevant to combatting corruption and securing government effectiveness.
| Table 2: PFM Correlations to Corruption and Government Effectiveness |
| PFM quality assessed using PEFA Performance Indicators |
Control of Corruption |
Trace Risk Index |
Government Effectiveness |
| Degree of integration & reconciliation between personal records and payroll data |
Significant Correlation |
No significant correlation |
Significant Correlation |
| Effectiveness of internal controls for non-salaried expenditure |
No significant correlation |
Significant Correlation |
Significant Correlation |
| Frequency and distribution of internal audit reports |
Significant correlation* |
Significant Correlation |
Significant Correlation |
*This correlation is significant at a 95% confidence interval.
The general inference we take from this exercise is that good PFM practice is likely to be beneficial to the advancement of good public service delivery and economic performance in developing countries.
Effective PFM reforms to combat corruption
Endemic corruption should be confronted through location-specific action prioritized on three factors: national detriment, effectiveness of the measures proposed, and capacity of the administration to effect the proposals.
Reform proposals should be designed to cover key weaknesses but avoid technical complexity that cannot be sustained. For instance, does the state have a sufficiently robust communications network and the necessary information and communications technology skills available to enable public sector organisations to undertake their purchasing from private sector suppliers using internet-based systems; or, are manual system improvements coupled with greater transparency in awarding contracts preferable, at least in the short term? Next, financial regulations need to be coherent and simplified where necessary. They should be more exacting in areas of high risk and high value.
Internal audit often requires improved capacity and must have reporting access to the most senior government official. External audit reports should have full public disclosure and external auditors should have access to public accounts committees that are informed by independent expert support.
The public must be made aware of the service standards they can expect and have access to effective complaints mechanisms in order to ensure value for money. Also, business and professional associations must be encouraged to voice concerns about corruption and poor financial practices.
Transparency of policy decisions and of financial performance is imperative through government information systems, among which government websites are increasingly important. But free media reporting and comment are essential to securing all such reforms.
Wider supportive activities
Perhaps some of the most important PFM reform activities are not of a strictly financial nature. Senior officials and politicians must demonstrate exemplary leadership, civil service watchdogs should underpin standards of conduct and should be invested with investigatory powers, codes of conduct should be adopted as a condition of employment, recruitment must be made on merit, appraisal and disciplinary processes must be robust, and there must be adequate standards of induction and in-service training.
Judicial systems must be freed from corruption and political interference, and consideration should be given to establishing special courts for corruption.
Opportunities for corruption can be reduced by avoiding personal contact through the use of online service delivery (where feasible) and by eliminating unnecessary bureaucracy. Transferring services of a commercial nature from public to private sector providers should be considered, although this requires careful implementation and continuing regulation in some cases.
The role of development partners
International development partners, particularly the large aid organizations, are well positioned to establish appropriate incentive frameworks, identify opportunities, and adopt the necessary long-term perspective required for PFM reforms. These situations are not suitable for pre-packaged solutions. Rather, the frameworks should include actively managed, locally focused programs requiring collaboration between governments and development partners to track progress and drive change, with ownership of the programs vested in client states.
Development partner funding for reform activities should be linked to the attainment of specific milestones previously agreed with governments and released in tranches as agreed reforms are realized. Such improvements are beginning to gain ground and must be complemented by effective advocacy for transparency in financial matters and press freedom.
Conclusion
The level of corruption in developing countries, including the use of tax havens for sheltering the proceeds of top tier corruption, has become a current issue. In addition, corrupt environments threaten trade relations with developing countries and the criminalization of bribery in the home countries of foreign nationals, although an essential development, adds to the deterrent effect for foreign-based businesses.
Economist Gabriel Zucman estimates that over 30 percent of all Africa’s financial wealth is stored in tax havens, of which it may be assumed that a substantial proportion goes untaxed. The conclusion drawn from this is that even if the poor pay their fair share in taxes, the world’s wealthiest often do not. Reforms of tax law and administration are clearly required as part of the PFM reform agenda.
The eradication of endemic corruption is an enormous challenge for developing countries. PFM reform has much to offer, but international development partners need to do more to support collaborative change processes and plan for the long haul.
[1] David Fellows and John Leonardo are Principals and Cornelia Körtl is an Associate of PFMConnect. Their work covers development projects in Africa, Asia, and the Pacific Islands.
[2] A wide-ranging discussion of PFM practice is well beyond the confines of this article. We refer only to practices that are particularly relevant to the control of corruption. See Stephen Peterson ‘Public Finance and Economic Growth in Developing Countries: Lessons from Ethiopia’s reforms’ for a thought-provoking and very readable commentary on the challenges facing those who would design financial systems for developing countries.
[3] World Bank: Combating Corruption in Indonesia Enhancing Accountability for Development 2003
[4] Mushtaq Khan understands corruption as a ‘type of illegal rent seeking’ (Khan, 2006. State weakness in developing countries and strategies of institutional reform – Operational Implications for Anti-Corruption Policy and A case-study of Tanzania, p.9). For a complete understanding of his theory on rent-seeking see Khan, M. and Jomo, K.S. (eds) (2000). Rents, Rent-Seeking and Economic Development: Theory and Evidence in Asia. Cambridge: Cambridge University Press.
[5] The Trace Matrix assesses the risk of encountering business bribery in a particular country; higher scores imply higher risk of encountering bribery expectations (for more information see here). A discussion of the methodology employed to determine the correlations presented in Tables 1 (and 2) is available here.
[6] For the PEFA system and its findings see www.pefa.org

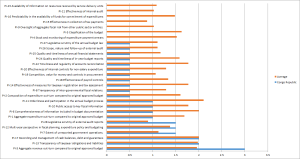
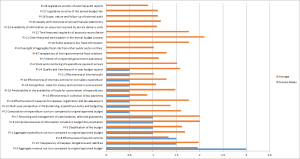
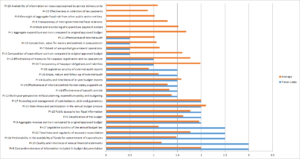 Download a pdf version of Figure 2 here (Timor Leste PIs) to review individual PI scores in more detail.
