Timor-Leste Public Financial Management Profile
Introduction
This note presents a series of charts which provide an overview of Timor-Leste’s recent public financial management (PFM) performance based on this country’s 2014 Public Expenditure and Financial Accountability (PEFA) assessment. Comparisons are made between Timor-Leste’s performance and the performance of the other twenty-three countries that had PEFA assessments published in 2014-2015. All analyses have been prepared using results reported from using the 2011 PEFA methodology.
Overall PFM performance
Individual country PFM performance has been determined by applying the following points scale to reported individual performance indicator (PI) scores as presented in Table 1. No points were allocated to PIs that were not scored because data was unavailable, a D score was given or the PI was not applicable.
Table 1: PI scoring methodology
|
PEFA PI score |
Points allocated |
|
A |
3 |
|
B+ |
2.5 |
|
B |
2 |
|
C+ |
1.5 |
|
C |
1 |
| D+ |
.5 |
| D |
0 |
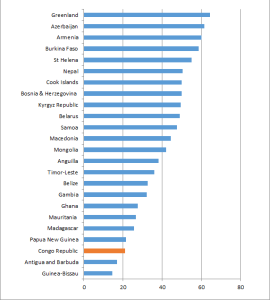
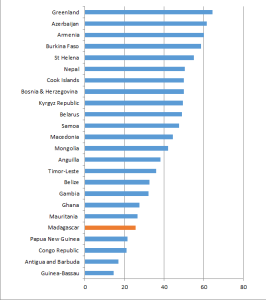
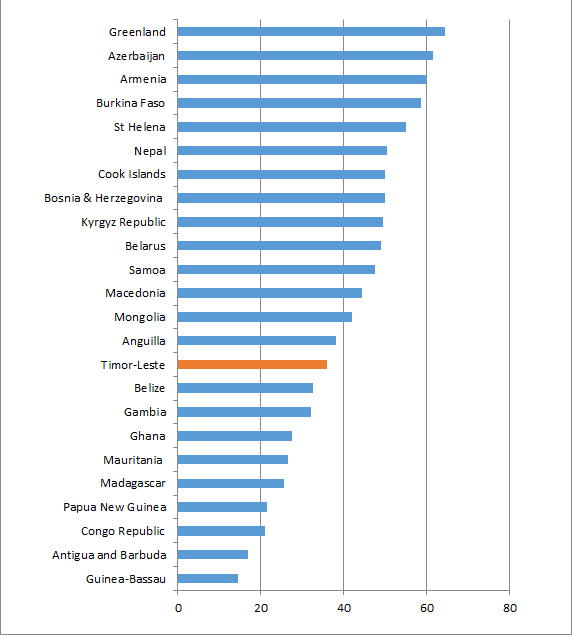
The graph in Figure 1 below shows Timor-Leste’s overall score was ranked fifteenth out of the twenty-four countries.
Figure 1: Aggregate PEFA scores for 24 countries
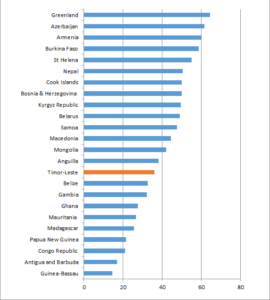
Download a png version of Figure 1 here (Timor-Leste’s overall result) to review the overall scores of Timor-Leste and the twenty-three other countries in more detail.
Details of the distribution of overall country scores across PFM performance categories, as determined by PFMConnect, are presented in Table 2. Timor-Leste’s overall score was 36 points.
Table 2: Distribution of country PFM performance levels
| PFM performance | Overall Scores | Number of countries |
| Very strong | 66.37-84 | 0 |
| Strong | 49.57-66.36 | 8 |
| Moderate | 32.77-49.56 | 7 |
| Weak | 15.97-32.76 | 8 |
| Very weak | 0-15.96 | 1 |
| Total | 24 |
Timor-Leste’s overall PFM performance is classified as “moderate”.
PI performance
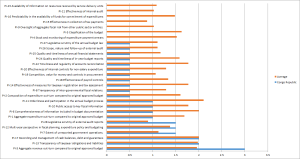
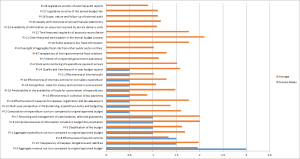
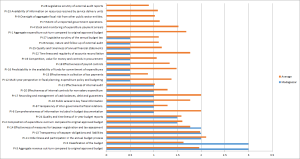
The graph in Figure 2 below shows the scores for Timor-Leste’s individual PIs compared with the average score recorded for each PI across the twenty-four PEFA assessments we have studied. Please note that no scores were recorded for the top six indicators in Figure 2 as one indicator (PI-8) was not applicable, two indicators (PI-4 and PI-15) were not assessed and three other indicators (PI-1, PI-9 and PI-23) received D scores.
Figure 2: Timor-Leste PI score comparisons
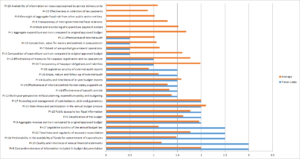 Download a pdf version of Figure 2 here (Timor Leste PIs) to review individual PI scores in more detail.
Twenty-seven PIs were assessed. Fourteen PIs had scores above the country average, one PI had a score equal to the country average whilst twelve PIs had scores below the country average.
Performance across key PFM activities
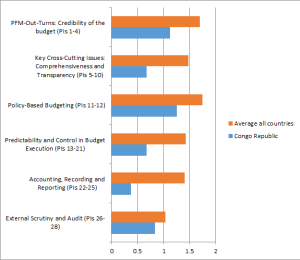
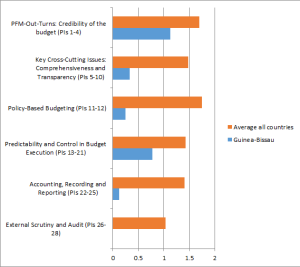
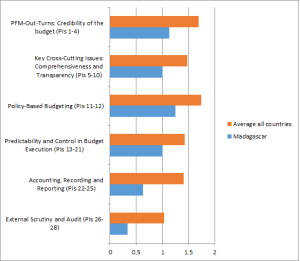
The graph in Figure 3 below shows the average scores for the six key PFM activities compared with the average score recorded for these activities across the twenty-four country PEFA assessments we have studied.
Figure 3: Timor-Leste key PFM activity comparisons
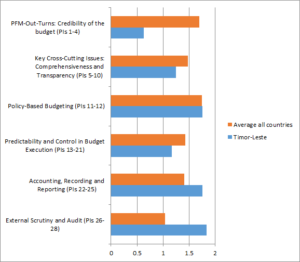
Three key PFM activities recorded scores above the country average whilst three other key PFM activities recorded scores below the country average. Download a png version of Figure 3 here (Timor-Leste’s key PFM activities) to review these scores in more detail.
PEFA ASSESSMENT
You can download the 2014 PEFA assessment for Timor-Leste here.
