Regional Africa/Asia SIDS PFM digital transparency update
Our June 2020 video “Improving PFM digital transparency in SIDS finance ministries” examined finance ministries (MoFs) use of digital platforms such as websites and social media to provide public financial management (PFM) related information in small island developing states (SIDS). Recent PFM digital transparency regional trends in Africa and Asia (including the Middle East) SIDS are examined in our “Regional Africa/Asia SIDS PFM digital transparency update” video.
Africa/Asia SIDS PFM digital transparency regional trends
PFM digital transparency trends were analysed for 7 Africa/Asia SIDS where MoF websites were active in the 2020 September quarter to provide the basis for this regional trends analysis:
- Bahrain
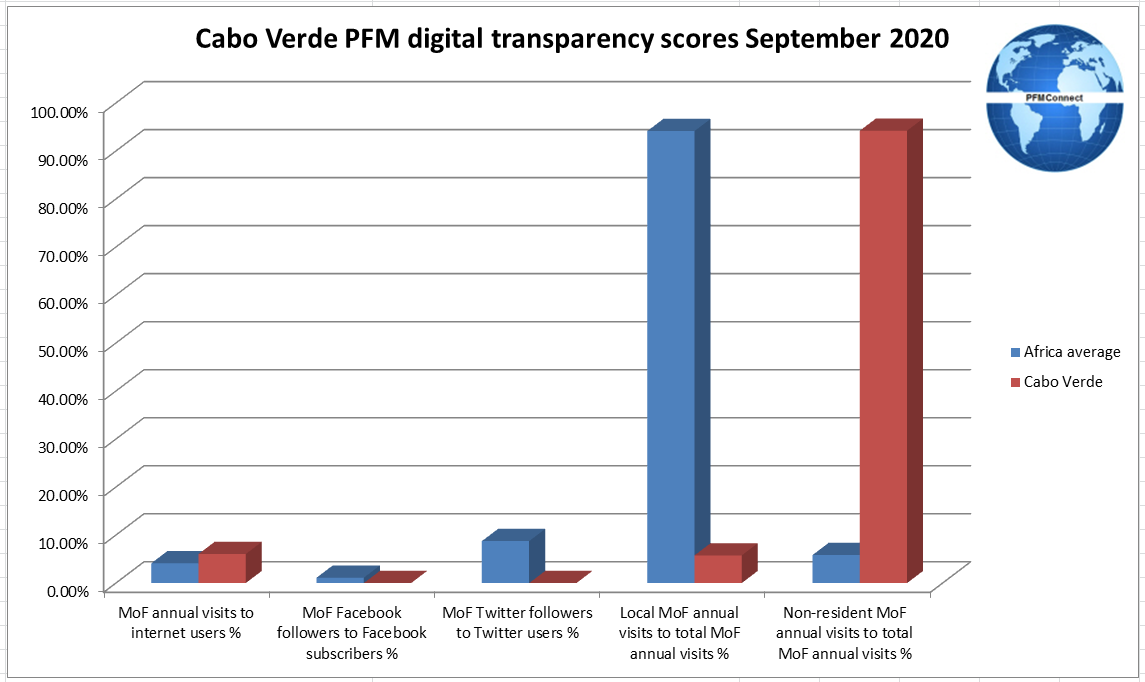
- Cabo Verde
- Maldives
- Mauritius
- Seychelles
- Singapore
- Timor-Leste
Three Africa/Asia SIDS did not have active MoF websites in the 2020 September quarter.
Charts for the following regional indicators are presented:
- MoF website penetration levels for the 2020 March and September quarters. The figures used in these charts were obtained using a two-step process. Actual visit data for the March and September 2020 quarters was annualised to provide projections of estimated 2020 visits. The resulting 2020 annual MoF website visit projections were divided by the number of country internet users to obtain MoF website penetration levels.
- Domestic and non-resident visits to MoF websites for the 2020 March and September quarters; these charts reflect the percentage of visits to MoF websites attributable to local residents and non-residents in the 2020 March and September quarters based on actual visit data.
- Rates of change in MoF website visits; this data is based on changes to MoF visit levels between the 2020 March and September quarters.
- MoF Facebook penetration levels as at June 2020 and October 2020; these figures were obtained by dividing actual MoF Facebook follower numbers by the number of country Facebook subscribers.
- Changes in Facebook follower numbers between June 2020 and October 2020; these charts reflect changes in the respective MoF Facebook follower numbers.
- MoF Twitter penetration levels as at October 2020; these figures were obtained by dividing actual MoF Twitter follower numbers by the number of country Twitter subscribers.
- Changes in Twitter follower numbers between June 2020 and October 2020; these charts reflect changes in the respective MoF Twitter follower numbers.
Key regional analysis findings
Some of the key findings from our analysis are as follows:
- Estimated total Africa/Asia SIDS MoF 2020 visits in the 2020 September quarter were 11.53% higher than in the 2020 March quarter for the 6 MoFs where data was available for both quarters
- Total Africa/Asia SIDS local resident MoF visits to the above-mentioned 6 MoF websites increased by 26.89% in the 2020 September quarter over the 2020 March quarter whilst total non-resident MoF visits fell by 29.17%
- Africa/Asia SIDS MoF Facebook follower numbers (and overall Africa SIDS average MoF Facebook penetration levels) increased by 7.16% between June 2020 and October 2020 where comparative data was available
- Africa/Asia SIDS MoF Twitter follower numbers (and overall Africa SIDS average MoF Twitter penetration levels) increased by 41.03% between June 2020 and October 2020 where comparative data was available