How Useful are Perception Indices of Corruption to Developing Countries?

Posted by David Fellows[1]

The value and limitations of perception indices 

There are numerous corruption perception indices. They provide an outsider’s impression of the prevalence of corruption across the various branches of government. Some indices focus on issues of bribery, others are more general in scope. Some indices aim to engage with the general public, and others with businesses or NGOs. Perception indices can incentivise governments to tackle corruption given the reputational damage that they can inflict.

The shortcomings of perception indices, however, have been widely recognised, including in recent studies by UNDP and the IMF[2]. Their evidential base is limited; survey samples are generally small; within the same index a variety of methodologies may apply so they can lack internal consistency; methodologies change so trends can be questionable; standardisation is difficult to achieve between or even within countries and, as a result, the ranking of countries can vary from one perception index to another.

The relevance of objective data     

Those agencies and officials responsible for preparing these indices are aware of the deficiencies and make considerable efforts to mitigate them. Their key deficiencies are unassailable, however. Perception indices are based on impression, personal experience and hearsay rather than hard fact. In a multi-faceted study of villagers’ perceptions of corruption affecting road building in Indonesia, Olken finds that perceptions are a good indicator of the presence but not the quantum of corruption. He concludes that “there is little alternative to continuing to collect more objective measures of corruption, difficult though that may be”[3]. These factors can allow governments to diminish the importance of the messages that perception surveys contain.

An alternative approach has been proposed in a recent paper by Fazekas[4]. The paper gives an account of recent research into public procurement in which legal, regulatory and administrative records have been analysed to reveal the presence of corruption. Relevant factors include: the characteristics of the tendering process; the political affiliations and personal connections of suppliers; and the location and transparency of information about the ownership of these supplier companies. Fazekas correlates these various data sets to reveal behaviour that indicates a skewing of contract awards toward suppliers with particular characteristics.

Fazekas uses the term ‘objective’ to refer to factual data that are not mediated by stakeholders’ perceptions, judgments, or self-reported experiences. Nevertheless, the data are based on provable characteristics (e.g., from suppliers and procurement agencies). This approach, however, can provide some significant challenges. Databases may not be available electronically, thus hampering data collection, and information is not collected on a systematic basis across countries. Despite these reservations, the approach can produce valuable evidence identifying areas of public administration that are especially prone to corruption, the role of officials in facilitating corruption, and the means by which corruption is being perpetrated.

Objective data analysis and developing countries

European countries and the USA have been at the forefront of this kind of work, but it also has potential for guiding administrative scrutiny and reform in developing countries. The necessary analysis could be undertaken by internal auditors, anti-corruption agencies, or other oversight bodies. These agencies could use the results to improve system design, and commission detailed forensic investigations of those concerned.

Fazekas uses sophisticated statistical techniques, but simpler methods could also be employed to measure inappropriate administrative processes, potentially illicit flow of funds between parties with close personal ties, the unexplained accumulation of personal wealth, citizens’ complaints, and other indicators of corruption. These results could then be used to identify potential levels and sources of corruption and, if acted on, lend credence to the government’s anti-corruption commitments.

The approach outlined above is relevant to national and local government, as well as public corporations where significant levels of corruption can occur at the highest levels. Such work could be enhanced through external moderation and research collaboration across national boundaries, perhaps at regional level. A recent piece by the present author, published here, discusses the growing relevance of digital media to governance reform.

The importance of national leadership

Objective data analysis can offer a clearer insight into the systemic nature of corrupt behaviour, thus providing a more precise indication of the corrupt parts of an administration, the number of external parties that are engaged in corruption, and features of the PFM system that need to be strengthened. It can provide data to support a vigilant administration that wishes to maintain pressure on corruption, complementing efforts to increase prosecutions or administrative reforms.

Whatever ideas are advanced, they will all require commitment from national leaders if they are to succeed.

[1] David Fellows is Co-principal of PFMConnect. He is an accountant and PFM specialist with significant interests in digital service development and performance management. His thanks are extended to Cornelia Körtl and Domenico Polloni for their invaluable contribution to this article.

[2] UNDPs Guide to Measuring Corruption and Anti-Corruption (2015). See also IMF 2017, “The Role of the Fund in Governance Issues – Review of the Guidance Note, Preliminary Considerations”.

[3] Benjamin A Olken, “Corruption Perceptions vs Reality” –  https://economics.mit.edu/files/3931

[4] Mihály Fazekas “A Comprehensive Review of Objective Corruption Proxies in Public Procurement”  https://papers.ssrn.com/sol3/papers.cfm?abstract_id=2891017.
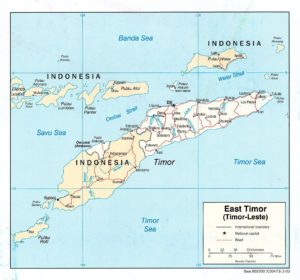


Timor-Leste Public Financial Management Profile

CIA-TimorLeste

Introduction

This note presents a series of charts which provide an overview of Timor-Leste’s recent public financial management (PFM) performance based on this country’s 2014 Public Expenditure and Financial Accountability (PEFA) assessment. Comparisons are made between Timor-Leste’s performance and the performance of the other twenty-three countries that had PEFA assessments published in 2014-2015. All analyses have been prepared using results reported from using the 2011 PEFA methodology.

Overall PFM performance

Individual country PFM performance has been determined by applying the following points scale to reported individual performance indicator (PI) scores as presented in Table 1. No points were allocated to PIs that were not scored because data was unavailable, a D score was given or the PI was not applicable.

Table 1: PI scoring methodology

PEFA PI score

Points allocated

A

3

B+

2.5

B

2

C+

1.5

C

1

D+

.5

D

0

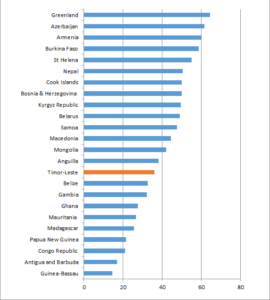
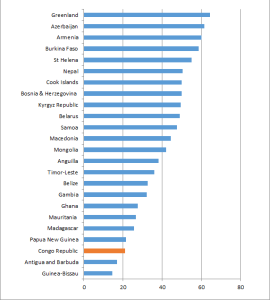
The graph in Figure 1 below shows Timor-Leste’s overall score was ranked fifteenth out of the twenty-four countries.

 Figure 1: Aggregate PEFA scores for 24 countries

Timor-Leste overall result

Download a png version of Figure 1 here (Timor-Leste’s overall result) to review the overall scores of Timor-Leste and the twenty-three other countries in more detail.

Details of the distribution of overall country scores across PFM performance categories, as determined by PFMConnect, are presented in Table 2. Timor-Leste’s overall score was 36 points.

Table 2: Distribution of country PFM performance levels

PFM performance Overall Scores Number of countries
Very strong 66.37-84 0
Strong 49.57-66.36 8
Moderate 32.77-49.56 7
Weak 15.97-32.76 8
Very weak 0-15.96 1
Total 24

Timor-Leste’s overall PFM performance is classified as “moderate”.

PI performance

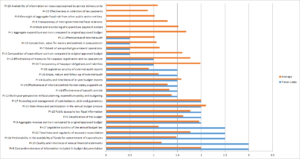
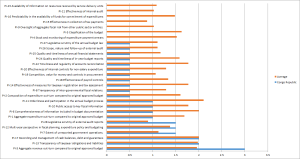
The graph in Figure 2 below shows the scores for Timor-Leste’s individual PIs compared with the average score recorded for each PI across the twenty-four PEFA assessments we have studied. Please note that no scores were recorded for the top six indicators in Figure 2 as one indicator (PI-8) was not applicable, two indicators (PI-4 and PI-15) were not assessed and three other indicators (PI-1, PI-9 and PI-23) received D scores.

Figure 2: Timor-Leste PI score comparisons

Timor-Leste relative performance PIsDownload a pdf version of Figure 2 here (Timor Leste PIs) to review individual PI scores in more detail.

Twenty-seven PIs were assessed. Fourteen PIs had scores above the country average, one PI had a score equal to the country average whilst twelve PIs had scores below the country average.

Performance across key PFM activities

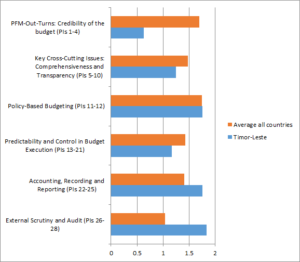
The graph in Figure 3 below shows the average scores for the six key PFM activities compared with the average score recorded for these activities across the twenty-four country PEFA assessments we have studied.

 Figure 3: Timor-Leste key PFM activity comparisons

Timor-Leste relative performance for key PFM activities

Three key PFM activities recorded scores above the country average whilst three other key PFM activities recorded scores below the country average. Download a png version of Figure 3 here (Timor-Leste’s key PFM activities) to review these scores in more detail.

PEFA ASSESSMENT

You can download the 2014 PEFA assessment for Timor-Leste here.

Download pdf


Corruption Correlations

Corruption Correlations

Our blog “International Development and the Challenge of Public Sector Corruption” discusses the results of our examination of correlations for the control of corruption and government effectiveness and public financial management (PFM) performance.

Corruption and Government Effectiveness

Correlations were calculated for the relationships between the control of corruption (capturing perceptions of the extent to which public power is exercised for private gain) and government effectiveness (including the quality of public services) for 184 countries using data from the World Bank’s 2013 Worldwide Governance Indicators (WGI), together with World Bank 2013 per capita income data and Rand Corporation’s Trace (bribery) Matrix risk scores for these countries.

The Trace (bribery) Matrix risk scores have an inverse relationship with corruption control levels i.e. low Trace Matrix risk scores indicate relatively favourable levels of control over corruption whilst high Trace Matrix risk scores indicate relatively poor control over corruption. Strong relationships between WGI control over corruption /government effectiveness scores and Trace Matrix risk scores will result in relatively high negative correlation values.

Results were prepared for the total sample of 184 countries as well as the halves and quartiles of the sample.

Corruption and Public Financial Management

Correlations were calculated for the relationships between some measures of PFM performance and the measures of corruption and government effectiveness for the 39 developing countries for which Public Expenditure and Financial Accountability (PEFA) assessments were made available during the past three years from 2013 to 2015. The respective PFM performance measures used are performance indicators prescribed in the PEFA methodology applicable in 2011 comprising the initial 2005 indicator set and subsequent amendments.

Results were also prepared for this sample of 39 countries as well as the halves and quartiles of the sample.

Correlations download

The correlations are presented in a spreadsheet that can be downloaded here.


Republic of Congo Public Financial Management Profile

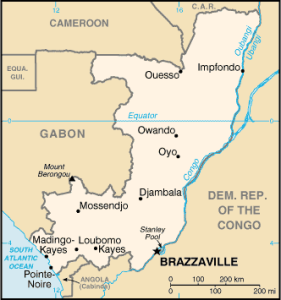
Congo Republic Cf-map

Introduction

This note presents a series of charts which provide an overview of the Republic of Congo’s recent public financial management (PFM) performance based on this country’s 2014 Public Expenditure and Financial Accountability (PEFA) assessment. Comparisons are made between the Republic of Congo’s performance and the performance of the other twenty-three countries that had PEFA assessments published in 2014-2015. All analyses have been prepared using results reported from using the 2011 PEFA methodology.

Overall PFM performance

Individual country PFM performance has been determined by applying the following points scale to reported individual performance indicator (PI) scores as presented in Table 1. No points were allocated to PIs that were not scored because either data was unavailable, a D score was given or the PI was not applicable.

Table 1: PI scoring methodology

PEFA PI score

Points allocated

A

3

B+

2.5

B

2

C+

1.5

C

1

D+

.5

D

0

The graph in Figure 1 below shows the Republic of Congo’s overall score was ranked twenty-second out of the twenty-four countries.

 Figure 1: Aggregate PEFA scores for 24 countries

Congo Republic overall result

Download a png version of Figure 1 here (the Republic of Congo’s overall result) to review the overall scores of the Republic of Congo and the twenty-three other countries in more detail.

Details of the distribution of overall country scores across PFM performance categories, as determined by PFMConnect, are presented in Table 2. The Republic of Congo’s overall score was 21 points.

Table 2: Distribution of country PFM performance levels

PFM performance Overall Scores Number of countries
Very strong 66.37-84 0
Strong 49.57-66.36 8
Moderate 32.77-49.56 7
Weak 15.97-32.76 8
Very weak 0-15.96 1
Total 24

The Republic of Congo’s overall PFM performance is classified as “weak”.

PI performance

The graph in Figure 2 below shows the scores for the Republic of Congo’s individual PIs compared with the average score recorded for each PI across the twenty-four PEFA assessments we have studied. Please note that no scores were recorded for the top seven indicators in Figure 2 as one indicator (PI-15) was not assessed and six other indicators (PI-4, PI-5, PI-9, PI-16, PI-21 and PI-23) received D scores.

Figure 2: Republic of Congo PI score comparisons

Congo Republic relative performance PIs

Download a pdf version of Figure 2 here (the Republic of Congo PIs) to review individual PI scores in more detail.
Twenty-seven PIs were assessed. Five PIs had scores above the country average, one PI had a score equal to the country average whilst twenty-one PIs had scores below the country average.

Performance across key PFM activities

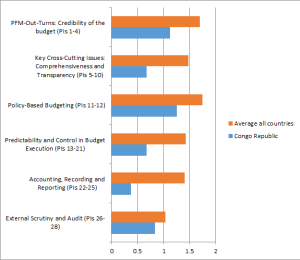
The graph in Figure 3 below shows the average scores for the six key PFM activities compared with the average score recorded for these activities across the twenty-four country PEFA assessments we have studied.

 Figure 3: Republic of Congo key PFM activity comparisons

Congo Republic - relative performance for key PFM activities

All six key PFM activities recorded scores below the country average. Download a png version of Figure 3 here (the Republic of Congo’s key PFM activities) to review these scores in more detail.

PEFA ASSESSMENT

You can download the 2014 PEFA assessment for the Republic of Congo here.

Download pdf