A future for the NHS

By David Fellows

I have no medical training or hospital management experience. I have from time to time had fleeting involvement in health development issues and I have been a hospital patient but I make no claims in writing this except that I am a general client of the NHS. Like millions of others I am simply concerned with the state of play: the lack of GP availability, the quality of some diagnostic services, the management of outpatient services and the speed of hospital referrals.

In exasperation the not-so-wealthy are paying privately for GP services, specialist consultations and surgery. The problem predates COVID. Heavy demands are placed on all health care systems by increasingly sophisticated diagnostics, medical procedures, patients care and medication. Add to this an increasingly elderly population and the country faces the prospect of a colossal financial burden for a less than satisfactory service.

The once acceptable approach of throwing money at the NHS is very obviously not working. Whatever sum is requested and provided is almost immediately decried as insufficient.

The motivation behind the current nurses pay dispute raises a further issue. The demands made are potentially destructive of the NHS, public services in general and the economy.  This raises the question as to whether nurses leaders are actually voicing a profound dissatisfaction with the NHS. Has its vastness and complexity come to alienate the very people on whose dedication it depends?

Hitherto the international direction of travel has been towards comprehensive national health services but none has gone so far with integration as the UK. Of course the NHS is not the sole UK provider. Private medicine is available in all fields. The scale of core state provision is around 70% of total medical service expenditure in the UK, similar to core provision in many other developed countries.

But elsewhere the core is often extensively disaggregated. For instance, multiple providers for commissioning (eg not for profit insurance schemes for core provision), hospitals and primary care. Levels of integration may be available. Core services may receive public and private financial contributions and provision may be made for equalising insurance costs of those with poor health. Services for children, unemployed and elderly may be financed by the state. There are many variants including discretionary aspects.

The weakness of the UK system is that the core is massively integrated and almost entirely state driven. The UK has broad geographic and localised divisions of the service but this does not overcome the fact that the centre has overarching responsibility and control. Government is commonly accepted as responsible in all respects. Complaints ultimately rest with Government, shortcomings usually blamed by officials and the media on lack of funds.

With respect to core provision the state is singly charged with operational responsibility for contributing vision, strategy, management, procurement, facilities, personnel, training , medical record development and patient communication. Personal dedication and compassion are valued but the organisational architecture is deficient in drivers for efficiency, innovation and flexibility of reward.

A state with more limited responsibility for delivery obtains a better vantage point from which services can be judged and structural refinements made. Where ultimate operational responsibility is distributed there are more active voices to explain the difficult issues that beset service delivery, more partnering choice for providers and more provider choice for patients.

The bait noire in this alternative universe is the US health system. It is becoming more comprehensive but remains unsatisfactory by the standards of many developed countries and is far too expensive. It is not the starting point for any new health provision model. Other developed countries offer more varied systems as Federico’s review of OECD countries[1] demonstrates.

Frederico is an advocate of progress by marginal refinement for health service development. I suggest this precept that should be readily embraced. The NHS is too exposed to cope with promises of major reform.

My proposal, therefore, is for the Government to affirm the benefits of a more diversely operated health service having both public and private sector counterparts with common regulatory and performance oversight. Where appropriate, public and private sector providers could share facilities perhaps with initial cost borne by the private counterpart and medical expertise could be shared too. Collaboration could also be relevant in the development of management and medical information systems. Private hospitals could qualify as teaching hospitals. It would be a gradual evolution.

The initiative could commence with a call for proposals covering all aspects of potential development within the themes of evolutionary change, service improvement, learning from diversity and providing the prospect of an affordable outcome to exchequer and citizens. These would become the criteria for success on which progress would depend. This is more specific and extensive than the reference to public service reform and the Integrated Care Board review contained in the Chancellor’s Budget Statement.

The outcome could embrace a variety of organisational arrangements. Taxation aspects may require phasing in to avoid any initial net cost to the exchequer. Ultimately there would be a reduction of cost and demand on public provision.

The development process could add significantly to the UK’s innovatory record in the fields of medical service delivery, information and medical technology. Opponents would charge the Government with developing a two tier health service but this would be difficult to sustain given the proposed criteria for pursuing the development.

The public can see the cracks widening and know that the solution is not just more state funding.  Any Government that had the courage to tackle the problem honestly and openly could be met with sighs of relief, particularly if the approach was subtle, gradual and sensitive to the dedication of NHS personnel. There are always reasons to postpone a difficult journey but surely the time has arrived.

David Fellows worked extensively in UK local government, was a leader in the use of digital communication in UK public service and became President of the Society of Municipal Treasurers. He was subsequently an advisor on local government reform in the UK Cabinet Office and an international advisor to the South African National Treasury. He is a director of PFMConnect, a public financial management consultancy, and a regular commentator on public financial management issues at home and abroad.


[1] Comparative Health Systems – A new Framework by Federico Toth, Cambridge University Press


Public financial management weaknesses can lead to corruption

Mauritania’s experience

Global corruption trends

Two recent reports on Global corruption trends highlight a number of states facing serious challenges and our analysis indicates some interesting links between corruption and standards of public financial management.

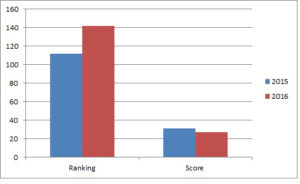
Transparency International’s recently released 2016 Corruption Perceptions Index for 2016 indicates that Mauritania’s ranking deteriorated noticeably in 2016 compared to the previous year. The full data set for all 176 countries  is available here and the Mauritanian data is shown at Figure 1.

Figure 1: Transparency International Corruption Perceptions Index Mauritania results 2015-2016

The World Economic Forum’s 2016 Global Competitiveness Survey, released on 15 September 2016, included the results of their annual Executive Opinion Survey which aims to measure critical concepts affecting the business environment such as the incidence of corruption. This survey shows that Mauritania was ranked 124th out of the 138 countries for corruption. The World Economic Forum’s 2016 Global Competitiveness Survey report is available here.

We have developed a spreadsheet showing (i) the country rankings for the World Economic Forum’s Executive Opinion Survey (not publicly available) and reported corruption impediment scores and (ii) a comparison of the Transparency International and World Economic Forum survey results that are available for 125 countries. Contact us if you would like to receive a copy of our spreadsheet.

We have  found that there is a significant overall negative correlation between the scores in the two surveys (a Pearson coefficient of -.78).

Mauritania’s poor PFM and poor corruption performance

Mauritania’s corruption rankings in both surveys are relatively poor with scores falling in the bottom 20% of the two surveys. Many developing countries, including Mauritania, face significant challenges in addressing corruption. We have previously identified a wide range of actions that governments (as well as the private sector) could take to assist in reducing corruption levels that include improving a range of public financial management practices in our blog International Development and the Challenge of Public Sector Corruption.

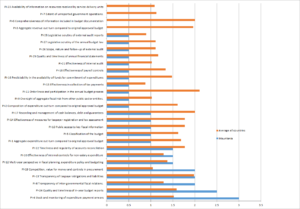
Last year we examined the Public Expenditure and Financial Accountability (PEFA) results of the twenty-four countries, including Mauritania,that published PEFA assessments during 2013-2015. Nine of the twenty-four countries studied, including Mauritania, had PEFA results indicating relatively weak public financial management; Mauritania was ranked 19th out of the twenty-four countries studied using a scoring system that the IMF has previously employed. Mauritania recorded relatively poor scores in a number of key PFM activities that are important in reducing corruption including payroll controls, internal audit, financial reporting and external audit; details are shown at Figure 2; this chart can be viewed in more detail here.

Figure 2: Mauritania PEFA indicators’ relative performance

Seventeen of the above-mentioned twenty-four countries feature in Transparency International’s 2016 Corruption Perceptions Index.  Sixteen countries (Ghana is the exception) recorded below –average scores in TI’s 2015 and 2016 surveys; details of the 2015 and 2016 scores and the percentage change between these periods are presented in Table 1.

Table 1: TI 2015-2016 scores for 2013-2015 PEFA assessment countries

PEFA score TI 2016 score TI 2015 score % change in 2015-2016 scores
Armenia 60 33 35 -5.71%
Azerbaijan 61.5 30 29 3.45%
Belarus 49 40 32 25.00%
Bosnia & Herzegovina 50 39 38 2.63%
Burkina Faso 58.5 42 38 10.53%
Congo Republic 21 20 23 -13.04%
Gambia 32 26 28 -7.14%
Ghana 27.5 43 47 -8.51%
Guinea-Bassau 14.5 16 17 -5.88%
Kyrgyz Republic 49.5 28 28 0.00%
Macedonia 44.5 37 42 -11.90%
Madagascar 25.5 26 28 -7.14%
Mauritania 26.5 27 31 -12.90%
Mongolia 42 38 39 -2.56%
Nepal 50.5 29 27 7.41%
Papua New Guinea 21.5 28 25 12.00%
Timor-Leste 36 35 28 25.00%

With ten of the seventeen countries in Table 1 recording either no change or a deterioration in their scores in 2016 (including Mauritania), the negative Pearson correlation between overall 2013-2015 PEFA scores and TI corruption scores for these countries strengthened from -0.41 in 2015 to -0.56 in 2016 pointing to the possible impact that poor PFM may have in facilitating corruption in the public (and private) sectors.

The World Bank noted in November 2016 that “Mauritania’s PFM system remains weak”. If countries, such as Mauritania, employ robust anti-corruption strategies, including actions to address key PFM weaknesses currently influencing corruption levels, they may in time be able to make some progress in curbing corruption.

Need to resolve a public financial management problem? Inquire now to schedule an initial online meeting.


Timor-Leste Public Financial Management Profile

CIA-TimorLeste

Introduction

This note presents a series of charts which provide an overview of Timor-Leste’s recent public financial management (PFM) performance based on this country’s 2014 Public Expenditure and Financial Accountability (PEFA) assessment. Comparisons are made between Timor-Leste’s performance and the performance of the other twenty-three countries that had PEFA assessments published in 2014-2015. All analyses have been prepared using results reported from using the 2011 PEFA methodology.

Overall PFM performance

Individual country PFM performance has been determined by applying the following points scale to reported individual performance indicator (PI) scores as presented in Table 1. No points were allocated to PIs that were not scored because data was unavailable, a D score was given or the PI was not applicable.

Table 1: PI scoring methodology

PEFA PI score

Points allocated

A

3

B+

2.5

B

2

C+

1.5

C

1

D+

.5

D

0

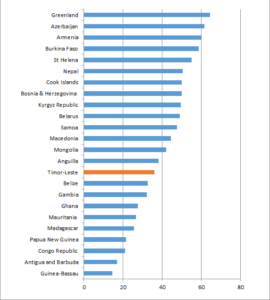
The graph in Figure 1 below shows Timor-Leste’s overall score was ranked fifteenth out of the twenty-four countries.

 Figure 1: Aggregate PEFA scores for 24 countries

Timor-Leste overall result

Download a png version of Figure 1 here (Timor-Leste’s overall result) to review the overall scores of Timor-Leste and the twenty-three other countries in more detail.

Details of the distribution of overall country scores across PFM performance categories, as determined by PFMConnect, are presented in Table 2. Timor-Leste’s overall score was 36 points.

Table 2: Distribution of country PFM performance levels

PFM performance Overall Scores Number of countries
Very strong 66.37-84 0
Strong 49.57-66.36 8
Moderate 32.77-49.56 7
Weak 15.97-32.76 8
Very weak 0-15.96 1
Total 24

Timor-Leste’s overall PFM performance is classified as “moderate”.

PI performance

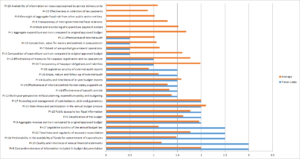
The graph in Figure 2 below shows the scores for Timor-Leste’s individual PIs compared with the average score recorded for each PI across the twenty-four PEFA assessments we have studied. Please note that no scores were recorded for the top six indicators in Figure 2 as one indicator (PI-8) was not applicable, two indicators (PI-4 and PI-15) were not assessed and three other indicators (PI-1, PI-9 and PI-23) received D scores.

Figure 2: Timor-Leste PI score comparisons

Timor-Leste relative performance PIsDownload a pdf version of Figure 2 here (Timor Leste PIs) to review individual PI scores in more detail.

Twenty-seven PIs were assessed. Fourteen PIs had scores above the country average, one PI had a score equal to the country average whilst twelve PIs had scores below the country average.

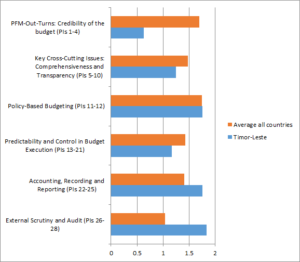
Performance across key PFM activities

The graph in Figure 3 below shows the average scores for the six key PFM activities compared with the average score recorded for these activities across the twenty-four country PEFA assessments we have studied.

 Figure 3: Timor-Leste key PFM activity comparisons

Timor-Leste relative performance for key PFM activities

Three key PFM activities recorded scores above the country average whilst three other key PFM activities recorded scores below the country average. Download a png version of Figure 3 here (Timor-Leste’s key PFM activities) to review these scores in more detail.

PEFA ASSESSMENT

You can download the 2014 PEFA assessment for Timor-Leste here.

Download pdf


Republic of Congo Public Financial Management Profile

Congo Republic Cf-map

Introduction

This note presents a series of charts which provide an overview of the Republic of Congo’s recent public financial management (PFM) performance based on this country’s 2014 Public Expenditure and Financial Accountability (PEFA) assessment. Comparisons are made between the Republic of Congo’s performance and the performance of the other twenty-three countries that had PEFA assessments published in 2014-2015. All analyses have been prepared using results reported from using the 2011 PEFA methodology.

Overall PFM performance

Individual country PFM performance has been determined by applying the following points scale to reported individual performance indicator (PI) scores as presented in Table 1. No points were allocated to PIs that were not scored because either data was unavailable, a D score was given or the PI was not applicable.

Table 1: PI scoring methodology

PEFA PI score

Points allocated

A

3

B+

2.5

B

2

C+

1.5

C

1

D+

.5

D

0

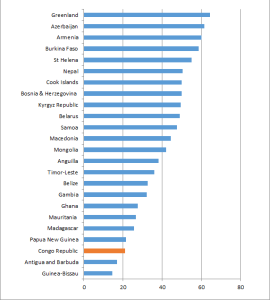
The graph in Figure 1 below shows the Republic of Congo’s overall score was ranked twenty-second out of the twenty-four countries.

 Figure 1: Aggregate PEFA scores for 24 countries

Congo Republic overall result

Download a png version of Figure 1 here (the Republic of Congo’s overall result) to review the overall scores of the Republic of Congo and the twenty-three other countries in more detail.

Details of the distribution of overall country scores across PFM performance categories, as determined by PFMConnect, are presented in Table 2. The Republic of Congo’s overall score was 21 points.

Table 2: Distribution of country PFM performance levels

PFM performance Overall Scores Number of countries
Very strong 66.37-84 0
Strong 49.57-66.36 8
Moderate 32.77-49.56 7
Weak 15.97-32.76 8
Very weak 0-15.96 1
Total 24

The Republic of Congo’s overall PFM performance is classified as “weak”.

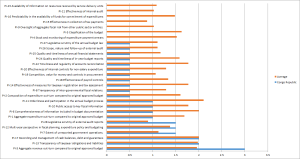
PI performance

The graph in Figure 2 below shows the scores for the Republic of Congo’s individual PIs compared with the average score recorded for each PI across the twenty-four PEFA assessments we have studied. Please note that no scores were recorded for the top seven indicators in Figure 2 as one indicator (PI-15) was not assessed and six other indicators (PI-4, PI-5, PI-9, PI-16, PI-21 and PI-23) received D scores.

Figure 2: Republic of Congo PI score comparisons

Congo Republic relative performance PIs

Download a pdf version of Figure 2 here (the Republic of Congo PIs) to review individual PI scores in more detail.
Twenty-seven PIs were assessed. Five PIs had scores above the country average, one PI had a score equal to the country average whilst twenty-one PIs had scores below the country average.

Performance across key PFM activities

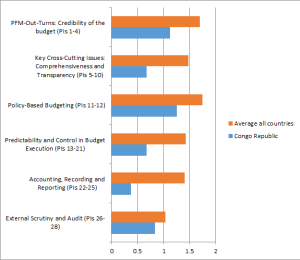
The graph in Figure 3 below shows the average scores for the six key PFM activities compared with the average score recorded for these activities across the twenty-four country PEFA assessments we have studied.

 Figure 3: Republic of Congo key PFM activity comparisons

Congo Republic - relative performance for key PFM activities

All six key PFM activities recorded scores below the country average. Download a png version of Figure 3 here (the Republic of Congo’s key PFM activities) to review these scores in more detail.

PEFA ASSESSMENT

You can download the 2014 PEFA assessment for the Republic of Congo here.

Download pdf