Regional Caribbean SIDS PFM digital transparency update
Our June 2020 video “Improving PFM digital transparency in SIDS finance ministries” examined finance ministries (MoFs) use of digital platforms such as websites and social media to provide public financial management (PFM) related information in small island developing states (SIDS). Recent PFM digital transparency regional trends in Caribbean SIDS are examined in our “Regional Caribbean SIDS PFM digital transparency update” video.

Caribbean SIDS PFM digital transparency regional trends

PFM digital transparency trends were analysed for 18 Caribbean SIDS where MoF websites were active in the 2020 September quarter to provide the basis for this regional trends analysis:

  • Belize
  • Cayman Islands
  • Cuba
  • Curacao
  • Dominica
  • Dominican Republic
  • Grenada
  • Guyana
  • Haiti
  • Jamaica
  • Montserrat
  • Puerto Rico
  • Saint Lucia
  • St. Kitts & Nevis
  • St. Vincent & Grenadines
  • Suriname
  • Trinidad & Tobago
  • US Virgin Islands

Eleven Caribbean SIDS did not have active MoF websites in the 2020 September quarter. Although The Bahamas MoF did not have a standalone website, it does have an active Facebook page.

Charts for the following regional indicators are presented:

  • MoF website penetration levels for the 2020 March and September quarters. The figures used in these charts were obtained using a two-step process. Actual visit data for the March and September 2020 quarters was annualised to provide projections of estimated 2020 visits. The resulting 2020 annual MoF website visit projections were divided by the number of country internet users to obtain MoF website penetration levels.
  • Domestic and non-resident visits to MoF websites for the 2020 March and September quarters; these charts reflect the percentage of visits to MoF websites attributable to local residents and non-residents in the 2020 March and September quarters based on actual visit data.
  • Rates of change in MoF website visits; this data is based on changes to MoF visit levels between the 2020 March and September quarters. 
  • MoF Facebook penetration levels as at June 2020 and October 2020; these figures were obtained by dividing actual MoF Facebook follower numbers by the number of country Facebook subscribers.
  • Changes in Facebook follower numbers between June 2020 and October 2020; these charts reflect changes in the respective MoF Facebook follower numbers.
  • MoF Twitter penetration levels as at October 2020; these figures were obtained by dividing actual MoF Twitter follower numbers by the number of country Twitter subscribers.
  • Changes in Twitter follower numbers between June 2020 and October 2020; these charts reflect changes in the respective MoF Twitter follower numbers.

Key regional analysis findings

Some of the key findings from our analysis are as follows:

  • Estimated total Caribbean SIDS MoF 2020 visits in the 2020 September quarter were 11.07% higher than in the 2020 March quarter for the 12 MoFs where data was available for both quarters

  • Total Caribbean SIDS local resident MoF visits to the above-mentioned 12 MoF websites increased by 24.66% in the 2020 September quarter over the 2020 March quarter whilst total non-resident MoF visits fell by 30.98%

  • Caribbean SIDS MoF Facebook follower numbers (and overall Caribbean SIDS average MoF Facebook penetration levels) increased by 14.99% between June 2020 and October 2020 where comparative data was available

  • Caribbean SIDS MoF Twitter follower numbers (and overall Caribbean SIDS average MoF Twitter penetration levels) increased by 51.45% between June 2020 and October 2020 where comparative data was available

Regional Africa/Asia SIDS PFM digital transparency update

Our June 2020 video “Improving PFM digital transparency in SIDS finance ministries” examined finance ministries (MoFs) use of digital platforms such as websites and social media to provide public financial management (PFM) related information in small island developing states (SIDS). Recent PFM digital transparency regional trends in Africa and Asia (including the Middle East) SIDS are examined in our “Regional Africa/Asia SIDS PFM digital transparency update” video.

Africa/Asia SIDS PFM digital transparency regional trends

PFM digital transparency trends were analysed for 7 Africa/Asia SIDS where MoF websites were active in the 2020 September quarter to provide the basis for this regional trends analysis:

  • Bahrain
  • Cabo Verde
  • Maldives
  • Mauritius
  • Seychelles
  • Singapore
  • Timor-Leste

Three Africa/Asia SIDS did not have active MoF websites in the 2020 September quarter.

Charts for the following regional indicators are presented:

  • MoF website penetration levels for the 2020 March and September quarters. The figures used in these charts were obtained using a two-step process. Actual visit data for the March and September 2020 quarters was annualised to provide projections of estimated 2020 visits. The resulting 2020 annual MoF website visit projections were divided by the number of country internet users to obtain MoF website penetration levels.
  • Domestic and non-resident visits to MoF websites for the 2020 March and September quarters; these charts reflect the percentage of visits to MoF websites attributable to local residents and non-residents in the 2020 March and September quarters based on actual visit data.
  • Rates of change in MoF website visits; this data is based on changes to MoF visit levels between the 2020 March and September quarters. 
  • MoF Facebook penetration levels as at June 2020 and October 2020; these figures were obtained by dividing actual MoF Facebook follower numbers by the number of country Facebook subscribers.
  • Changes in Facebook follower numbers between June 2020 and October 2020; these charts reflect changes in the respective MoF Facebook follower numbers.
  • MoF Twitter penetration levels as at October 2020; these figures were obtained by dividing actual MoF Twitter follower numbers by the number of country Twitter subscribers.
  • Changes in Twitter follower numbers between June 2020 and October 2020; these charts reflect changes in the respective MoF Twitter follower numbers.

Key regional analysis findings

Some of the key findings from our analysis are as follows:

  • Estimated total Africa/Asia SIDS MoF 2020 visits in the 2020 September quarter were 11.53% higher than in the 2020 March quarter for the 6 MoFs where data was available for both quarters

  • Total Africa/Asia SIDS local resident MoF visits to the above-mentioned 6 MoF websites increased by 26.89% in the 2020 September quarter over the 2020 March quarter whilst total non-resident MoF visits fell by 29.17%

  • Africa/Asia SIDS MoF Facebook follower numbers (and overall Africa SIDS average MoF Facebook penetration levels) increased by 7.16% between June 2020 and October 2020 where comparative data was available

  • Africa/Asia SIDS MoF Twitter follower numbers (and overall Africa SIDS average MoF Twitter penetration levels) increased by 41.03% between June 2020 and October 2020 where comparative data was available


Global SIDS PFM digital transparency update

Our June 2020 video “Improving PFM digital transparency in SIDS finance ministries” examined finance ministries (MoFs) use of digital platforms such as websites and social media to provide public financial management (PFM) related information in small island developing states (SIDS). In this “Global SIDS PFM digital transparency update December 2020” video recent SIDS PFM digital transparency trends are examined on a regional and country basis.

Regional PFM digital transparency analysis

Global SIDS PFM digital transparency trends have been analysed using the following regional classifications for countries where MoF websites were active:

  • Africa/Asia/Middle East (7 countries)

  • Caribbean (18 countries)

  • Pacific (11 countries)

Non-active SIDS MoF websites in the 2020 September quarter in the above-mentioned regions were as follows:

  • Africa/Asia/MiddleEast (3 countries)

  • Caribbean (11 countries)

  • Pacific (8 countries)

Charts for the following indicators are presented:

  • MoF website penetration levels for the 2020 March and September quarters. The figures used in these charts were obtained using a two-step process. Actual visit data for the March and September 2020 quarters was annualised to provide projections of estimated 2020 visits. The resulting 2020 annual MoF website visit projections were divided by the number of country internet users to obtain MoF website penetration levels.

  • Domestic and non-resident visits to MoF websites for the 2020 March and September quarters; these charts reflect the percentage of visits to MoF websites attributable to local residents and non-residents in the 2020 March and September quarters based on actual visit data.

  • Rates of change in MoF website visits; this data is based on changes to MoF visit levels between the 2020 March and September quarters. 

  • MoF Facebook penetration levels as at June 2020 and October 2020; these figures were obtained by dividing actual MoF Facebook follower numbers by the number of country Facebook subscribers.

  • Changes in Facebook follower numbers between June 2020 and October 2020; these charts reflect changes in the respective MoF Facebook follower numbers.

  • MoF Twitter penetration levels as at October 2020; these figures were obtained by dividing actual MoF Twitter follower numbers by the number of country Twitter subscribers.

  • Changes in Twitter follower numbers between June 2020 and October 2020; these charts reflect changes in the respective MoF Twitter follower numbers.

The above-mentioned regional analyses are also available here:

  • Africa/Asia/Middle East

  • Caribbean

  • Pacific

Key regional analysis findings

Some of our key findings from the regional analysis are as follows:

  • Increases were recorded in SIDS overall regional MoF penetration scores for SIDS MoF websites, SIDS Facebook followers and SIDS Twitter followers. This growth is partially attributable to MoF posts relating to COVID-19 topics. 

  • A material increase in the SIDS Caribbean MoF Twitter follower penetration score contributed to strong growth in the SIDS overall regional Twitter follower penetration score.

  • The increased interest in MoF digital platforms also resulted in material increases in the proportion of MoF website visits attributable to local residents and a consequent reduction in the proportion of MoF website visits attributable to non-residents. This trend was particularly evident in the Pacific where there was strong growth in Papua New Guinea MoF local resident visits.

  • In four of the SIDS countries with MoF Facebook pages, the number of Facebook followers exceeded estimated 2020 MoF website visits demonstrating the role social media can play in boosting transparency about SIDS MoF activities.

SIDS country PFM digital transparency analysis

SIDS PFM digital transparency trends have also been analysed for the 36 countries examined in the above-mentioned regional analysis.

Country charts presenting the following PFM digital transparency indicators are available:

  • MoF website penetration levels for the 2020 September quarter. The figures used in these charts were obtained using a two-step process. Actual visit data for the September 2020 quarter was annualised to provide projections of estimated 2020 visits. The resulting 2020 annual MoF website visit projections were divided by the number of country internet users to obtain MoF website penetration levels.

  • Domestic and non-resident visits to MoF websites for the 2020 September quarter; these charts reflect the percentage of visits to MoF websites attributable to local residents and non-residents in the 2020 September quarter based on actual visit data.

  • MoF Facebook penetration levels as at October 2020; these figures were obtained by dividing actual MoF Facebook follower numbers by the number of country Facebook subscribers.

  • MoF Twitter penetration levels as at October 2020; these figures were obtained by dividing actual MoF Twitter follower numbers by the number of country Twitter subscribers.

Each country chart presents the following results for each indicator: the available country results, the average regional score and the average score for all SIDS countries where a MoF website was available.

Analyses of trends in key country PFM digital transparency indicators are also available here:

  • Africa/Asia/Middle East

  • Caribbean

  • Pacific


Corruption and social media correlation outcomes in Africa

Does social media usage have any impact on country corruption levels? We have investigated the relationship between corruption and social media usage in Africa at a country level and present our findings below.

Methodology

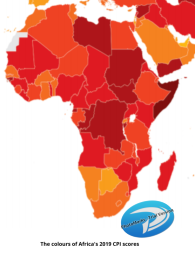
Transparency International’s 2019 CPI scores published in January 2020 are taken to represent the measure of corruption in Africa.

The social media activity at a country level is taken as the subscriber numbers provided for Facebook by Internet World Stats at www.internetworldstats.com as at 31stDecember 2019 and for Twitter by We Are Social as quoted in their ‘Digital 2020’ publication.

The Africa Population numbers are mid-year 2020 estimates taken from the United Nations Population Division published by Internet World Stats at www.internetworldstats.com.

Facebook data was available for 54 African countries in the CPI index but Twitter data was only available for 52 of those countries. These 52 countries were taken as our starting point.

We then removed from the list of 52 countries the 4 countries with distinctly higher corruption levels than the remainder as they did not offer results consistent with the remaining states which we consider to reflect the disruptive effect of very high corruption levels on social and economic behaviour. This leaves a sample of 48 countries.

Statistical robustness

The sample of 48 countries provides a confidence level of 95%. The margin of error is 5%.

Statistical Method Facebook Results Twitter Results
Pearson 0.657 0.699
Spearman 0.672 0.625

Conclusion

The above results are relatively robust from a statistical perspective. These demonstrate that, for the data used in our two samples, a strong relationship exists between 2019 CPI scores and per capita penetration levels of country Facebook and Twitter subscribers. This implies that the greater the level of public intercourse via social media the lower the level of corruption in the country concerned.