African ACAs’ digital media progress

By John Leonardo [1]
We recently reviewed the degree of usage of digital platforms by African anti-corruption agencies (ACAs) in a blog and supporting video. We also highlighted the opportunities that digital platforms offer African ACAs in pursuing their war on corruption in a separate blog earlier this year. In view of the interest in these topics we are now providing an update on African ACAs’ digital media progress in recent months.
1. African ACAs digital platform usage trends
1.1 Website usage
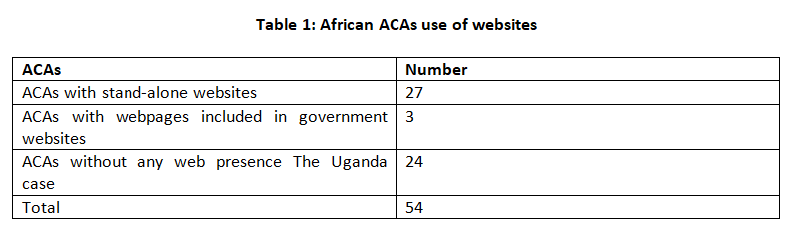
There has been no significant change in the use of websites by African ACAs since January 2021. Details of the use of websites by African ACAs as at mid-May 2021 are presented in Table 1.
Table 1: African ACAs use of websites
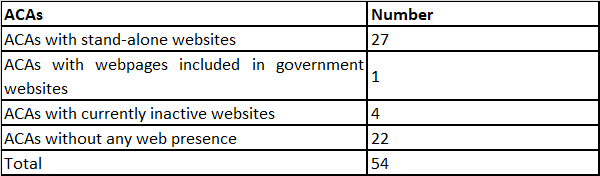
NB. Nigeria has two recognised ACAs with websites; Uganda has two recognised ACAs but only one has a website while the other uses only social media. One Nigerian ACA and the Ugandan ACA which only uses social media are not included in Table 1 or Table 2 below.
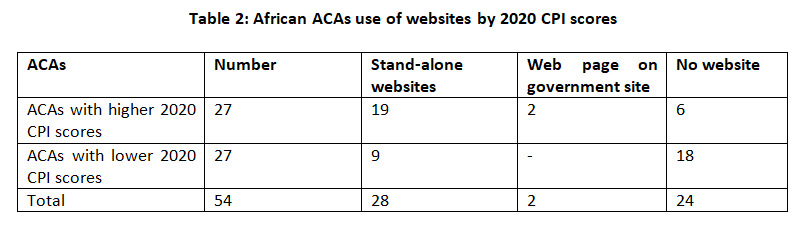
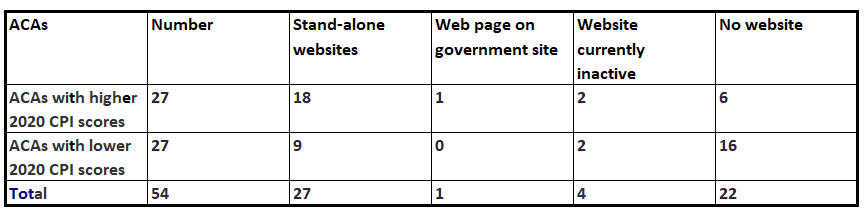
Table 2 provides details of the use of websites by African ACAs equally divided between those with higher 2020 Corruption Perceptions Index (CPI) scores and those with lower scores.
Table 2: African ACAs use of websites by 2020 CPI scores (data as of May 2021)
1.2 Website visit activity
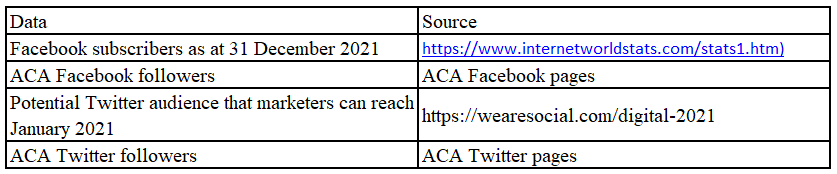
Quarterly data for website visits in the six months ended 31 March 2021 as obtained from similarweb (https://www.similarweb.com/ ) has been annualised and divided by country internet user numbers as at 31 December 2020 published by Internet World Stats (https://www.internetworldstats.com/stats1.htm), to provide an indication of ACA website penetration levels.
This shows a very low annualised average website penetration level for all ACAs of 0.32%, a decline of 18.70% from 411,126 in the 2020 December quarter.
The annualised average website penetration level for the 27 higher CPI scoring ACAs in the six months ended 31 March 2021was 47% greater than the remainder.
Mauritius (5.99%) and Madagascar (1.15%) continued to record favourable overall scores in the six months ended 31 March 2021 following their favourable performance in the 2020 December quarter.
1.3 Social media activity
Social media follower information was analysed for ACAs with Facebook and Twitter pages using the data available in early May 2021, listed below:
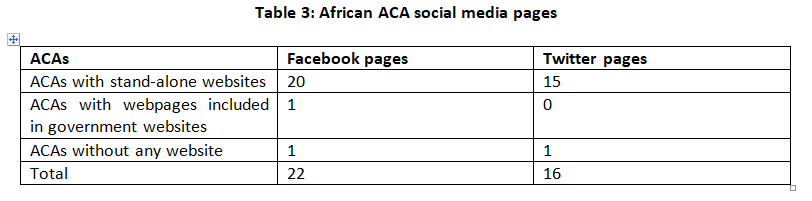
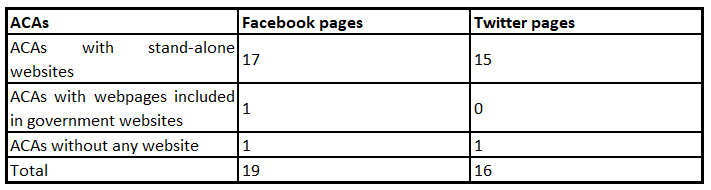
Details of current African ACA social media pages are presented in Table 3. NB the Facebook and Twitter pages of the two Nigerian and Ugandan ACAs are included in the data presented in Table 3.
Table 3: African ACA social media pages
1.3.1 Facebook activity
African country Facebook penetration rates obtained by dividing Facebook subscriber numbers by the number of internet users as at 31 December 2000 are presented in Figure 1.
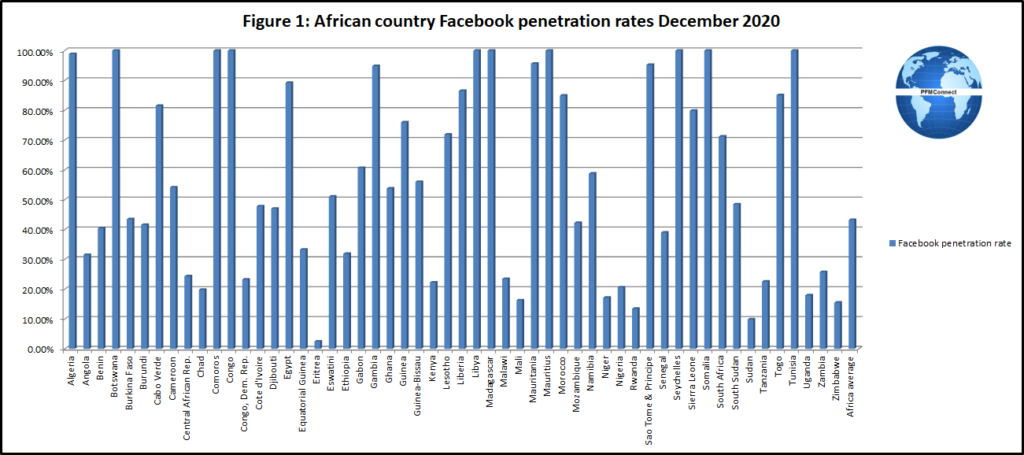
Currently less than one half of African ACAs have Facebook pages.
Key results
Total Facebook followers for ACAs measured on a country basis increased by 4.09% between mid-January 2021 and early May 2021.
Growth rates in African ACA Facebook follower numbers on a country basis between mid-January 2021 and early May 2021 are presented in Table 4.
Table 4: Change in African ACA Facebook
Follower numbers Mid-January 2021/Early May 2021
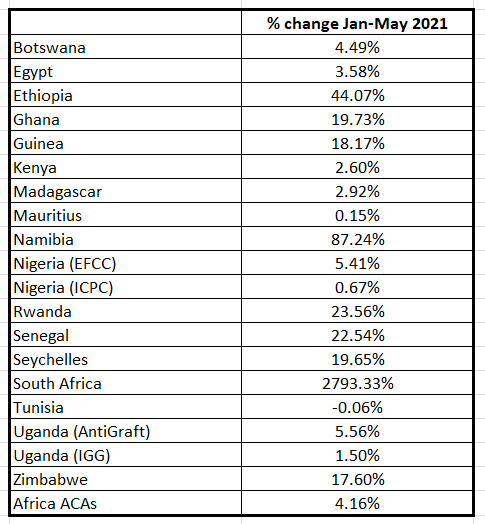
Facebook follower growth is being driven principally by increased public interest in corruption issues. For example, there was considerable Namibian media coverage about corruption in the 2021 March quarter whilst South Africa’s Special Investigation Unit (SIU) has received increased media coverage this year as a result of its anti-corruption activity. Ethiopia’s growth seems at least partly due to its particular posting activity discussed later in this article.
The average Facebook follower penetration level for African ACAs on a country basis (country ACA Facebook followers divided by total country Facebook subscribers) increased from 0.9% to 0.95% between mid-January 2021 and early May 2021.
Details of African ACAs’ Facebook follower penetration rates on a country basis (country ACA Facebook followers divided by total country Facebook subscribers) in early May 2021 are presented in Figure 2.
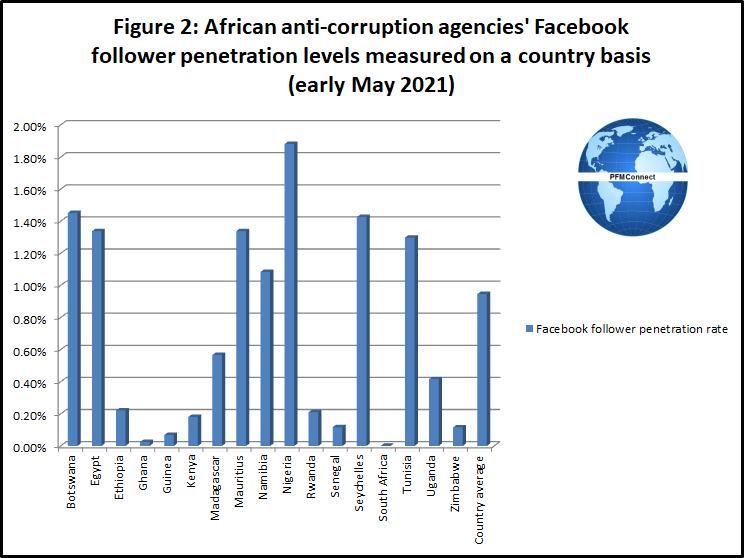
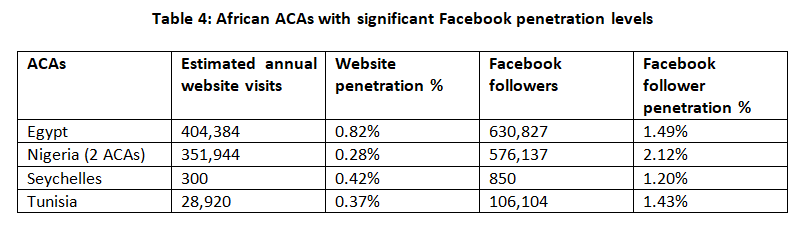
On a country basis, the average Facebook follower penetration rate for Nigeria (obtained by adding together the data for the two Nigerian ACAs) was the highest of the seventeen countries where ACAs have Facebook pages.
Facebook posting and engagement performance
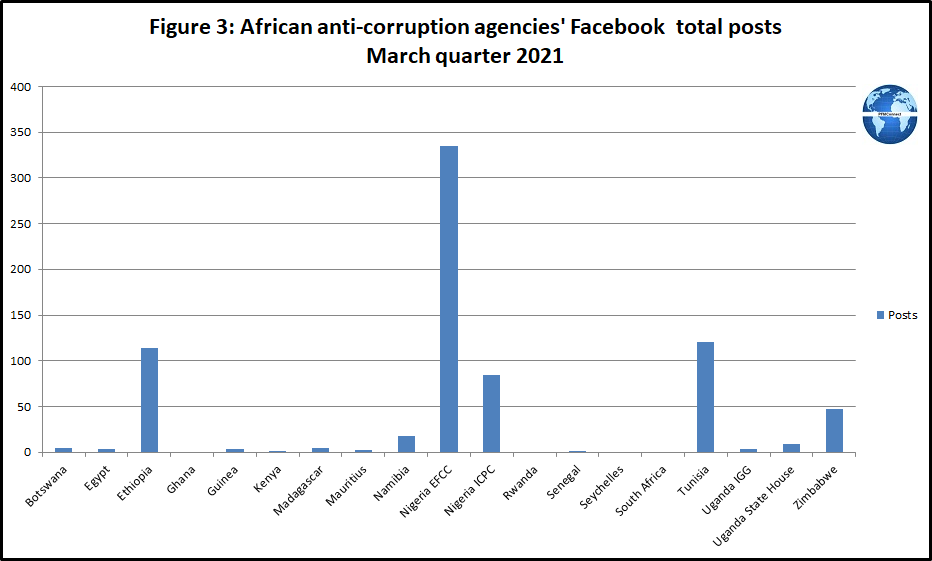
Trends in Facebook posting and engagement performance for the nineteen African ACAs with Facebook pages in the 2021 March quarter were examined.
Facebook posting performance across the nineteen African ACAs with Facebook pages during the 2021 March quarter varied sharply; the results for total Facebook posts during the 2021 March quarter are presented in Figure 3.
Facebook daily posting performance across the nineteen African ACAs with Facebook pages during the 2021 March quarter also varied sharply; the results for Facebook posting activity on a working day basis during the 2021 March quarter are presented in Figure 4.
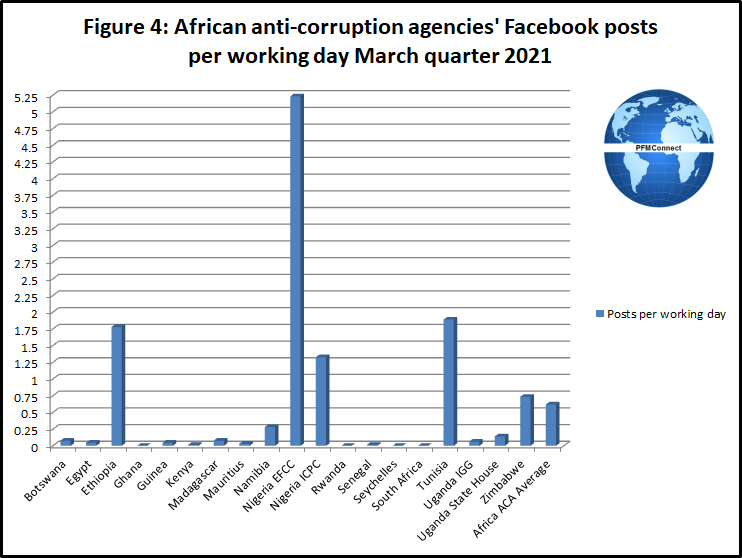
The average Facebook page posts 1.55 times per day according to a 3 November 20201 Social Media Perth post (https://www.smperth.com/resources/facebook/facebook-statistics) but African ACAs results are considerably below this figure with an average Facebook posting rate on a working day basis during the 2021 March quarter of 0.62. Only four African ACAs published more than one Facebook post per day during the 2021 March quarter (Ethiopia, Nigeria EFCC, Nigeria ICPC and Tunisia).
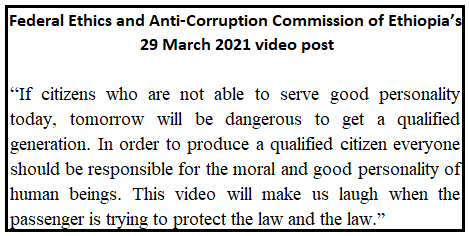
Community engagement data demonstrates the recent impact of video views on African ACA Facebook engagement trends.
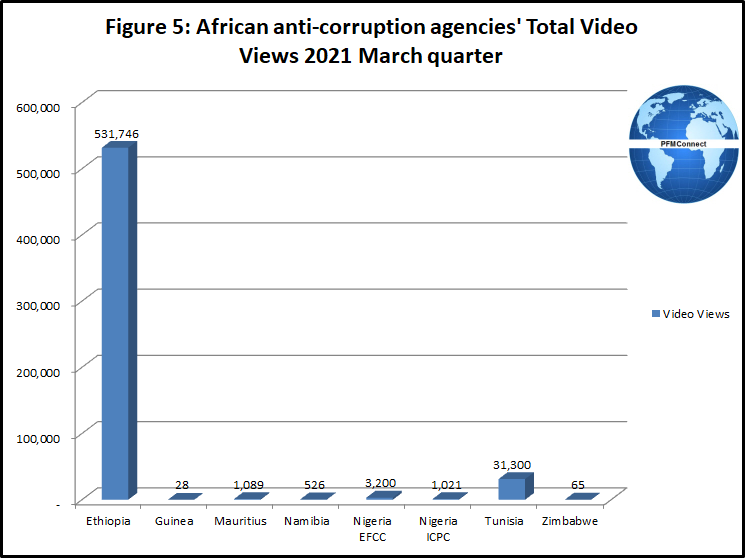
The Federal Ethics and Anti-Corruption Commission of Ethiopia has received a remarkable response to date to a video published on 29 March 2021discussing the personality required to be a good citizen (see box below). To date the video has received over 530,000 views.
Details of video views recorded on African ACA Facebook pages as at early June 2021 for videos posted during the 2021 March quarter are presented in Figure 5.
African ACA Facebook engagement trends have been examined on an engagement rate by post basis. This data has been derived on a two-step basis.
Firstly, a total figure for ACA Facebook views, likes, shares, and comments on a per post basis was derived for the 2021 March quarter; details are presented in Figure 6; totals excluding video views are also presented.
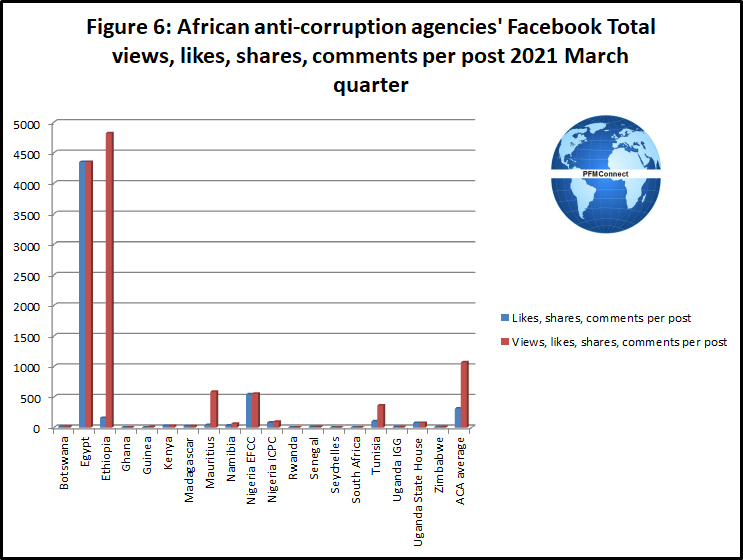
The data in Figure 6 reveals the contribution of video views to African ACAs’ Facebook posting activity in the 2021 March quarter.
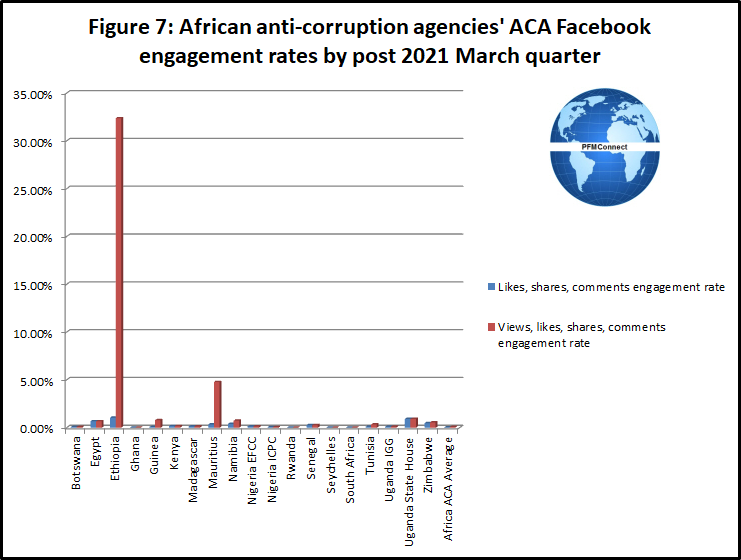
Secondly, the engagement rate of the above data by post is presented in Figure 7.
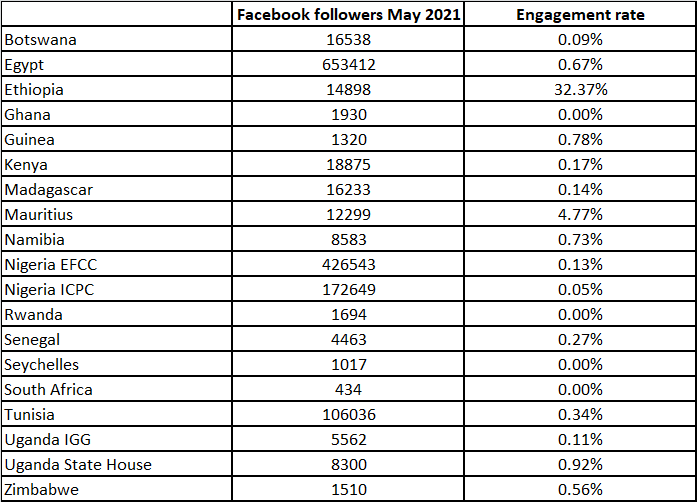
Details of African ACAs’ Facebook followers as at early May 2021 and engagement rates by post in the 2021 March quarter are presented in Table 5.
Table 5: African ACAs’ Facebook followers and engagement rate by post
Details of African ACAs’ Facebook posting activity and engagement rates by post in the 2021 March quarter are presented graphically in Figure 8.
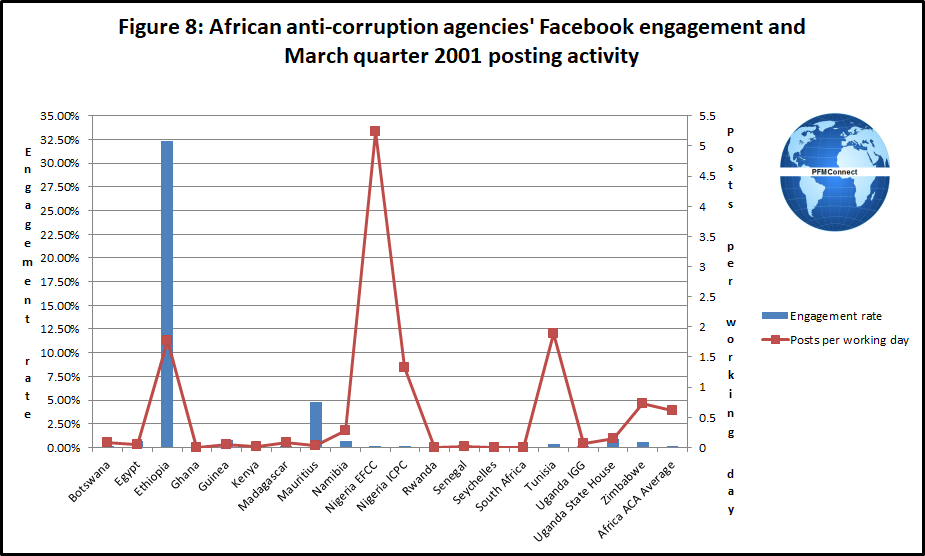
An analysis of the correlation between African ACAs’ Facebook posting activity and engagement rates by post in the 2021 March quarter found only a weak relationship exists. This outcome consistent with industry guidance which suggests content rather than activity attracts audiences the most. The correlation was not materially influenced by the higher engagement rates recorded by Ethiopia and Mauritius or the two Nigerian ACAs’ higher posting rate per working day.
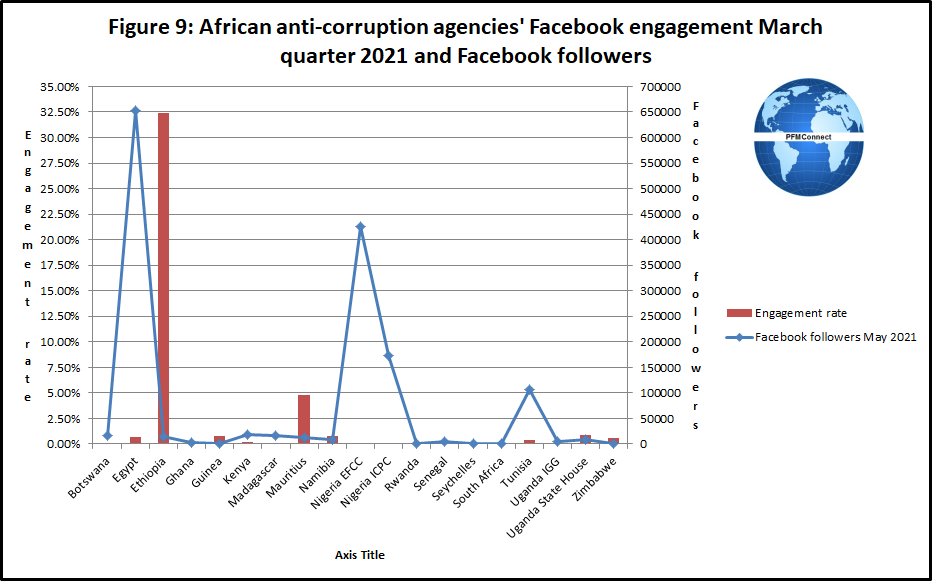
An analysis of the correlation between African ACAs’ Facebook follower numbers in early May 2021 and Facebook engagement rates by post in the 2021 March quarter using the data presented earlier in Table 5 found a very significant negative relationship. This correlation was also not materially influenced by the higher engagement rates recorded by Ethiopia and Mauritius or the two Nigerian ACAs’ higher posting rate per working day.
The data from Table 5 is presented graphically in Figure 9.
Social Media Perth also outlined in its 3 November 2020 post the following Facebook engagement rates:
- Pages with less than 10k fans have an average post engagement rate of 0.52%
- Pages with between 10k and 100k fans have an average post engagement rate of 0.28%
- Pages with more than 100k fans have an average post engagement rate of 0.10%
The Social Media Perth guidance suggests that the Egypt, Ethiopia, Guinea, Mauritius, Nigeria EFCC, Tunisia and Uganda State House ACAs achieved reasonable engagement levels in the 2021 March quarter with Ethiopia being the star performer.
While some ACAs have recorded reasonable engagement levels, improved content in Facebook posts should have a favourable impact on overall engagement levels. The majority of African ACAs could also increase their posting frequency.
Do corruption levels influence ACA Facebook follower penetration levels?
An analysis of correlations between 2020 CPI scores and early May 2021 ACA Facebook follower penetration levels demonstrated moderate relationships between 2020 CPI scores and ACA Facebook follower penetration levels in all countries where ACAs have Facebook pages and also for countries with higher 2020 CPI scores.
A weak negative relationship was noted between 2020 CPI scores and early May ACA Facebook follower penetration levels for countries with lower 2020 CPI scores. This data demonstrates that 2020 CPI scores are not currently a significant driver of ACA Facebook follower penetration levels.
Behind the African ACA Facebook data
A closer examination of the data covering country Facebook subscriber levels in African countries where ACAs currently have or do not have Facebook pages reveals some interesting trends.
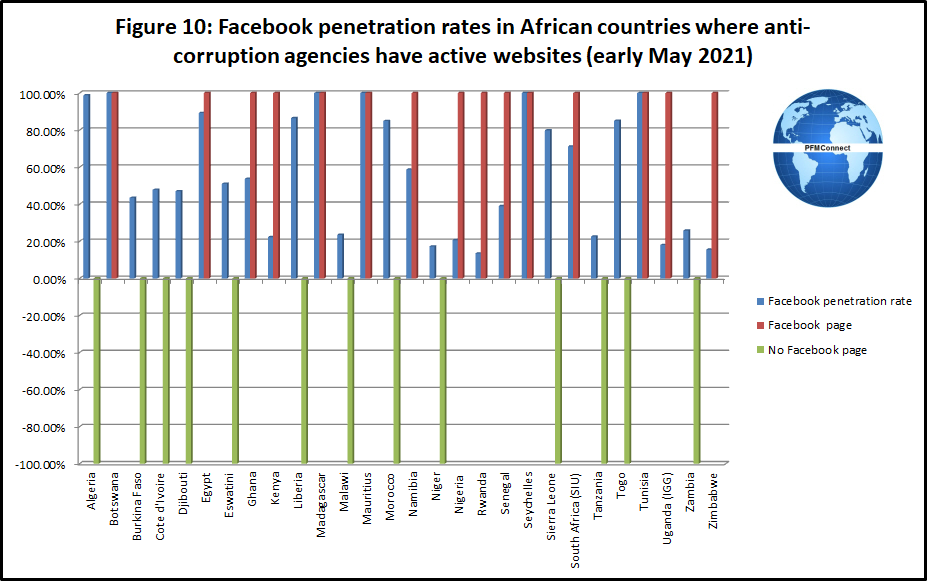
There are a number of ACAs with websites that do not have Facebook pages even though country Facebook penetration rates (total country Facebook subscribers divided by total country internet users) are relatively high. This group of countries includes Algeria, Morocco, Sierra Leone and Togo. The relevant data is presented in Figure 10. NB the green and red bars represent ACAs with or without Facebook pages.
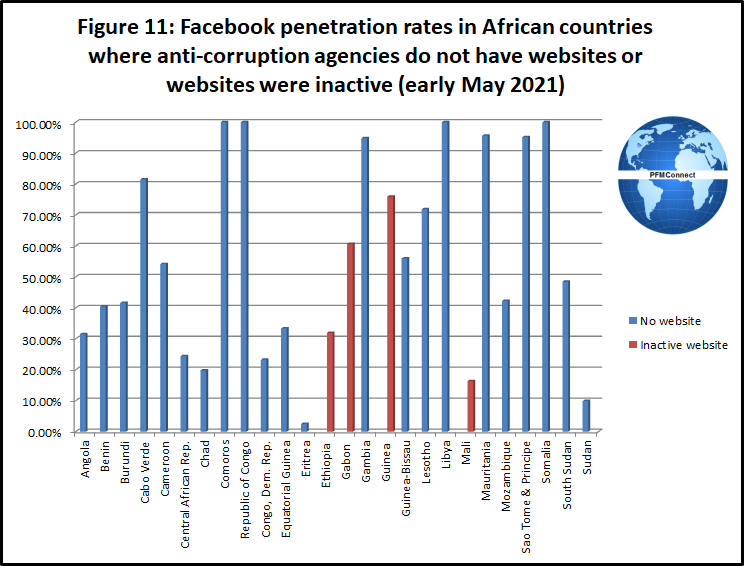
On the other hand, there are a number of countries where country Facebook penetration rates are relatively high but the respective ACAs do not have either websites or Facebook pages. This group of countries includes Comoros, Republic of Congo, Gambia, Libya, Sao Tome & Principe and Somalia. The relevant data is presented in Figure 11.
1.3.2 Twitter activity
African country Twitter penetration rates obtained by dividing Twitter subscriber numbers by the number of internet users as at January 2021 are presented in Figure 12.
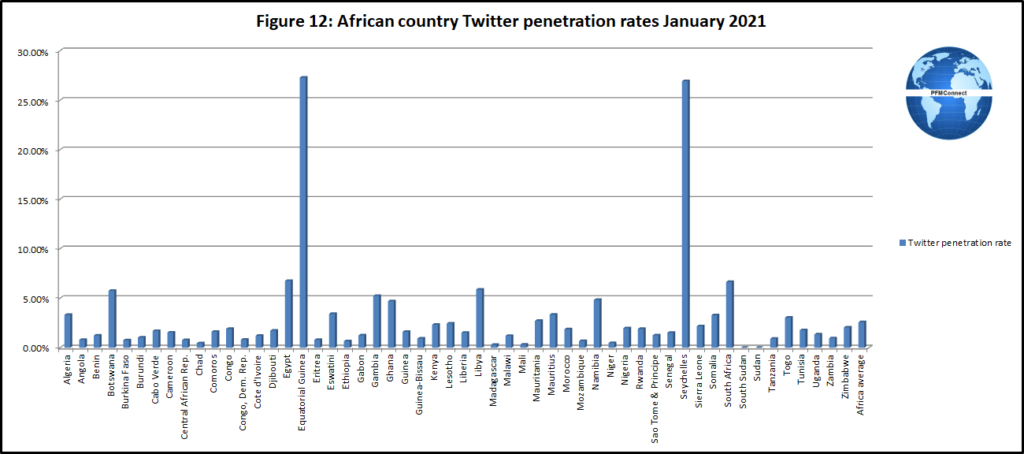
The number of African ACAs with Twitter pages is modest.
Key results
Total Twitter followers for African ACAs measured on a country basis increased by 2.59% between mid-January 2021 and early May 2021. Growth rates in African ACA Twitter follower numbers on a country basis between mid-January 2021 and early May 2021 are presented in Table 6.
Table 6: Change in African ACA Twitter Follower numbers Mid-January 2021/Early May 2021
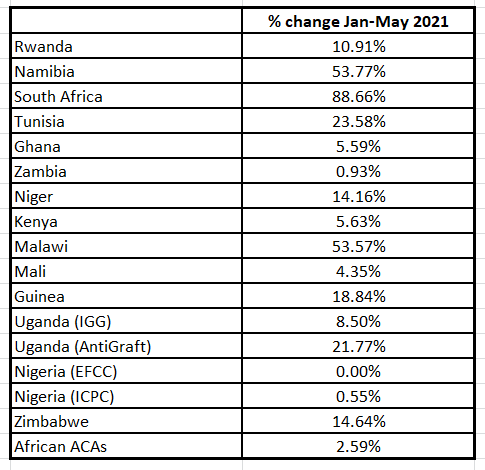
Twitter follower growth is being driven by increased public interest in corruption issues. Increased media coverage of corruption issues contributed to the relatively strong growth in Twitter follower numbers in Malawi, Namibia and South Africa in the 2021 March quarter.
The average Twitter follower penetration level for African ACAs on a country basis (country ACA Twitter followers divided by total country Twitter subscribers) increased from 19.75% to 20.26% between mid-January 2021 and early May 2021. Details of African ACAs’ Twitter follower penetration rates on a country basis in early May 2021 are presented in Figure 13.
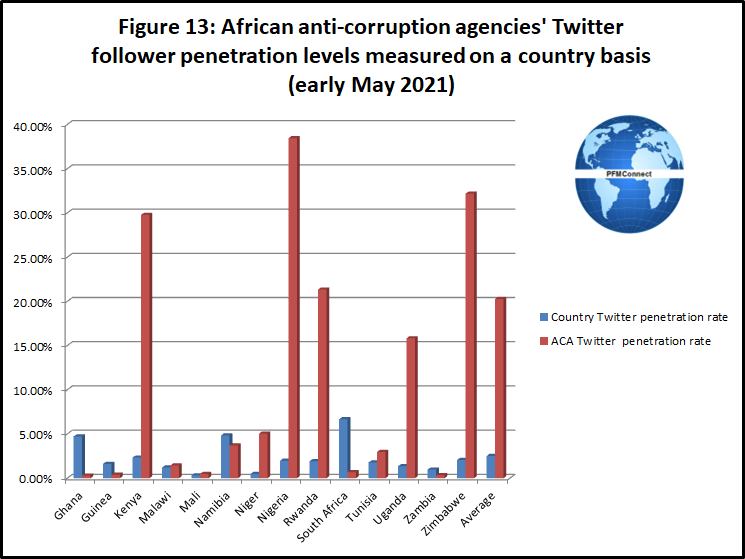
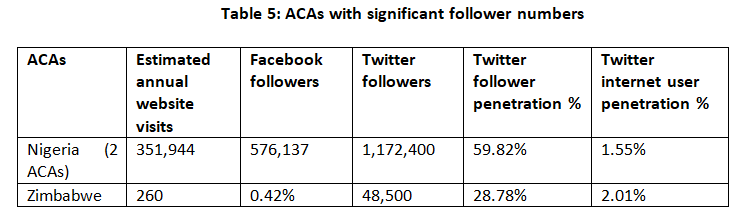
ACA Twitter follower penetration rates are currently very high in Kenya, Nigeria, Rwanda and Zimbabwe.
Twitter posting and engagement performance
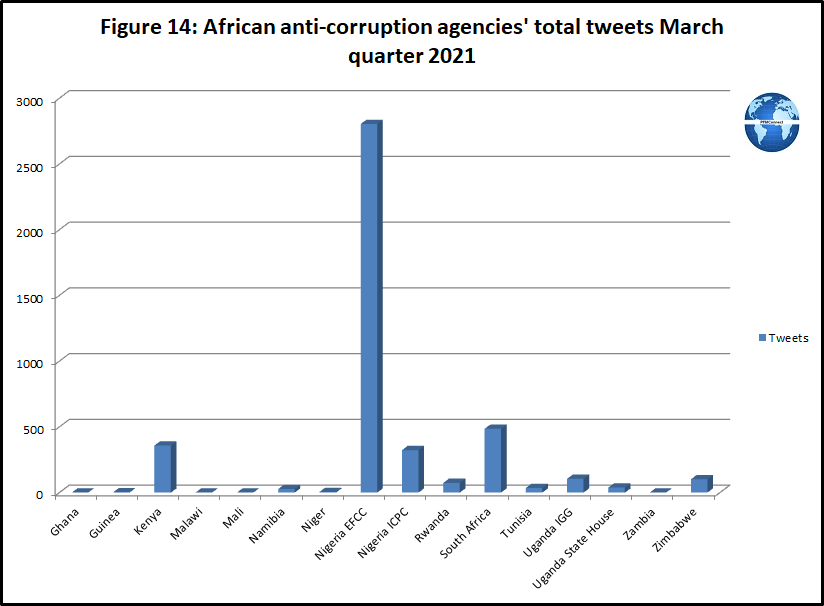
Trends in Twitter posting and engagement performance for the sixteen African ACAs with Twitter pages in the 2021 March quarter were examined.
Twitter tweeting performance across the sixteen African ACAs with Twitter pages during the 2021 March quarter also varied sharply; the results are presented in Figure 14.
Twitter tweeting performance per working day across the sixteen African ACAs with Twitter pages during the 2021 March quarter are presented in Figure 15.
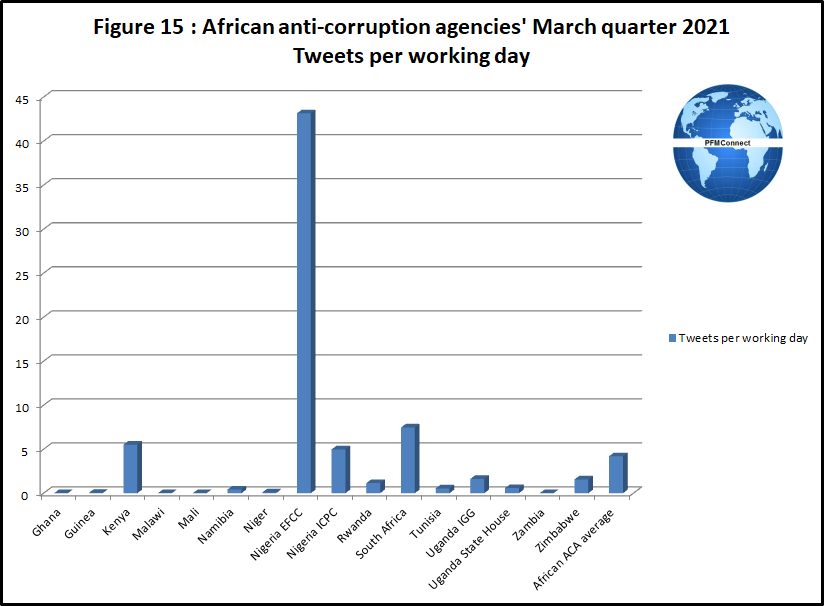
The figure derived for average tweets per day of 4.19 tweets per day for African ACAs with Twitter pages during the 2021 March quarter is relatively high average compared with a corporate brand median of 0.86 tweets per day quoted by Social Media Perth in a post on 1 October 2020 ( https://www.smperth.com/resources/twitter/twitter-statistics/).
Only four African ACAs published more than one tweet per working day during the 2021 March quarter (Kenya, Nigeria EFCC, Nigeria ICPC and South Africa).
An analysis of African ACA Twitter engagement trends has been made on an engagement rate by tweet basis based on individual tweet likes and retweets using a public engagement rate methodology as recommended by Social Status (https://www.socialstatus.io/twitter-engagement-rate-benchmark/). This data has been derived on a two-step basis.
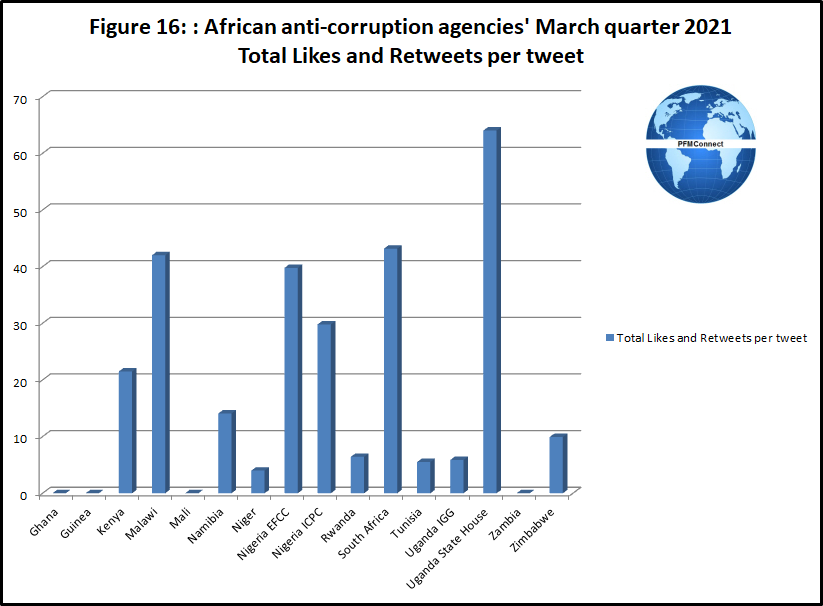
Firstly, African ACAs’ data for the total of all likes and retweets on a per tweet basis was derived for the 2021 March quarter; details are presented in Figure 16.
The second step in deriving African ACA Twitter engagement trends on an engagement rate by post basis was to divide the figures for the total of all likes and retweets on a per post basis by the number of ACA Twitter followers; details are presented in Figure 17.
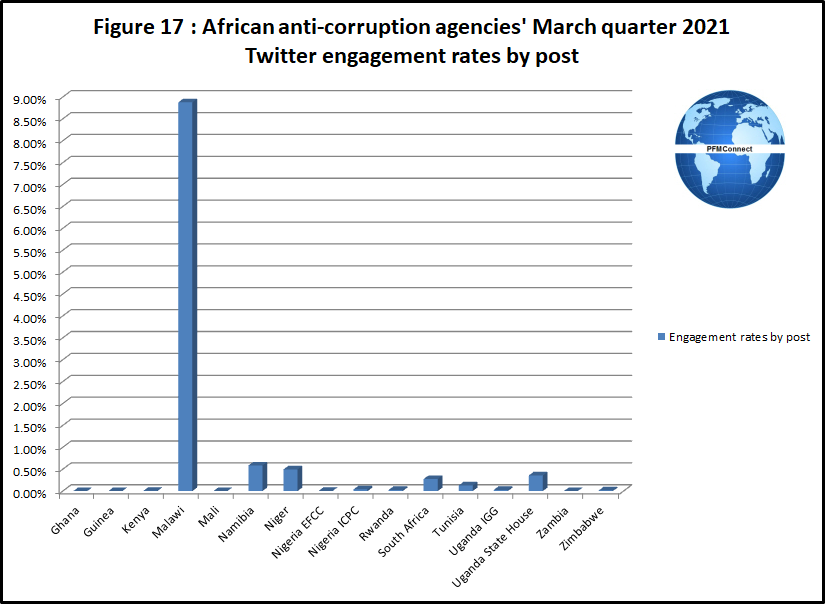
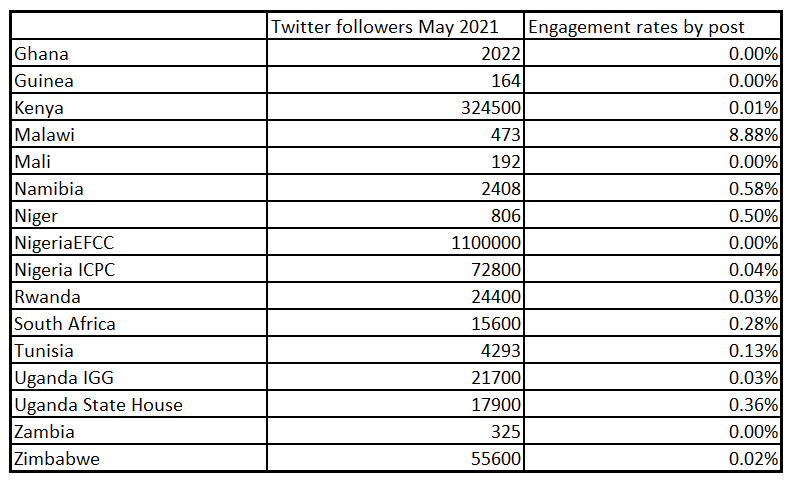
The data for African ACAs’ Twitter followers as at early May 2021 and engagement rates by post in the 2021 March quarter included in Figure 17 is also presented in Table 7.
Table 7: Twitter followers and engagement rates by post
Details of African ACAs’ Twitter followers as at early May 2021 and engagement rates by post and tweets per working day in the 2021 March quarter are presented in Figure 18.
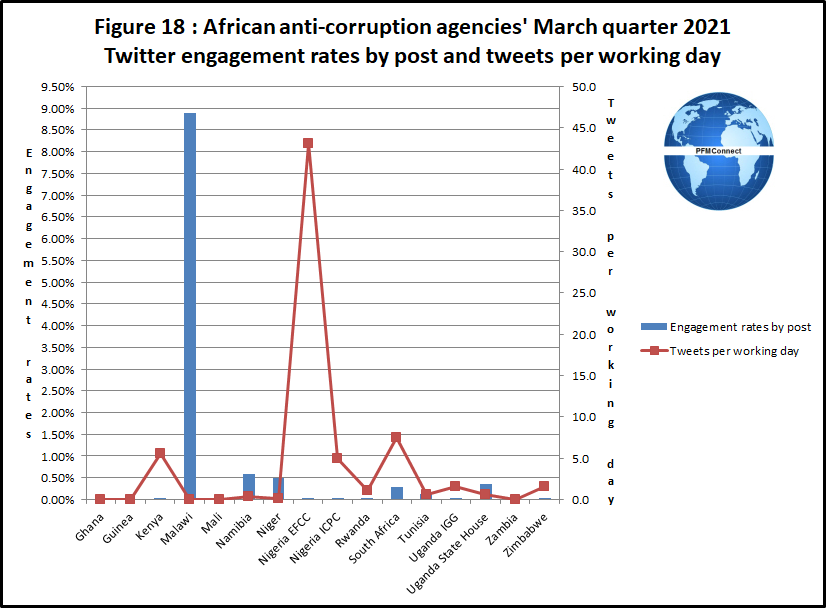
Six African ACAs achieved engagement rates by post above 0.10% with Twitter pages during the 2021 March quarter. Social Media Perth in a post on 1 October 2020 (https://www.smperth.com/resources/twitter/twitter-statistics/) suggested the median corporate twitter engagement rates was 0.048%.
An analysis of the correlation between Africa ACAs’ Twitter tweeting activity and engagement rates by post in the 2021 March quarter found a very weak negative relationship exists. This outcome is consistent with industry guidance which suggests content rather than activity attracts audiences the most.
The three African ACAs most active on Twitter (Kenya, Nigeria EFCC and Nigeria ICPC) all recorded relatively low engagement rates; this result suggests improved content in their tweets may well produce higher Twitter engagement rates.
While some ACAs have recorded reasonable engagement levels, improved content in tweets by a number of ACAs should have a favourable impact on overall engagement levels. Numerous African ACAs could also increase their tweeting frequency.
Behind the African ACA Twitter figures
A closer examination of the data covering country Twitter subscriber levels in African countries where ACAs currently have or do not have Twitter pages provides some interesting trends.
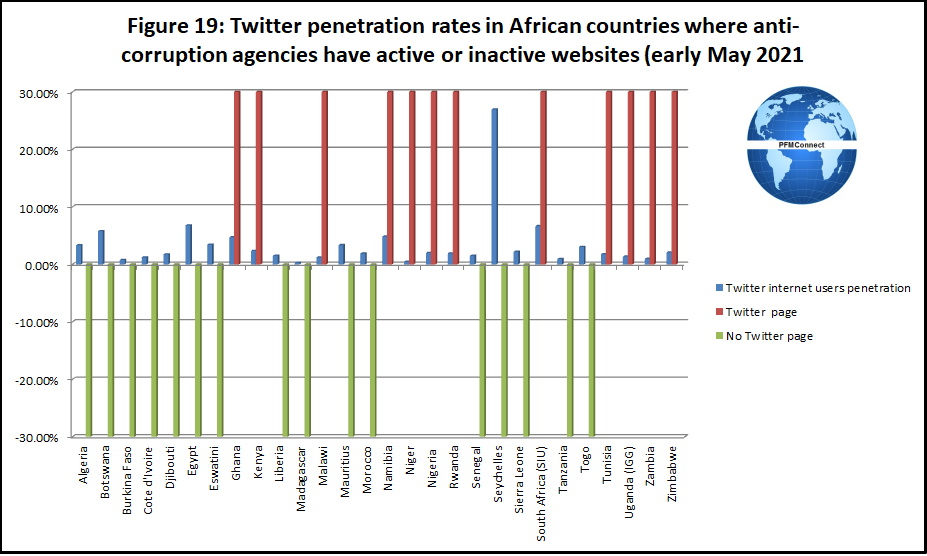
There are several ACAs with websites that do not have Twitter pages even though country Twitter penetration rates (total country Twitter subscribers divided by total country internet users) are relatively high. This group of countries includes Botswana, Egypt and the Seychelles. The relevant data is presented in Figure 19. NB the green and red bars represent ACAs with or without Twitter pages.
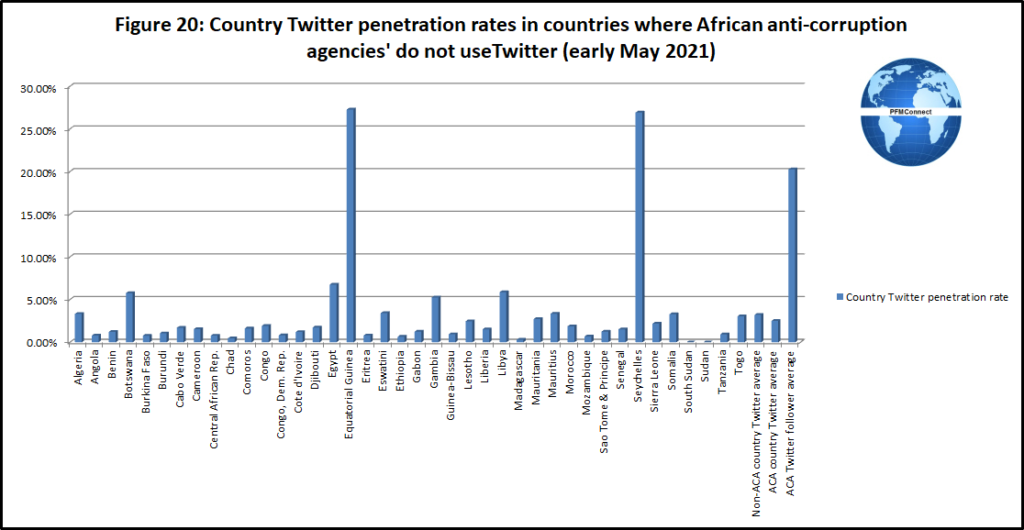
On the other hand, there are a few countries where country Twitter penetration rates are relatively high but the respective ACAs do not have either websites or Twitter pages. This group of countries includes Equatorial Guinea, Gambia and Libya.
The relevant data is presented in Figure 20.
Do corruption levels influence ACA Twitter follower penetration levels?
An analysis of correlations between 2020 CPI scores and ACA Twitter follower penetration levels demonstrated a weak negative relationship between 2020 CPI scores and ACA Twitter follower penetration levels in all countries where ACAs have Twitter pages.
A very weak relationship was recorded between 2020 CPI scores and ACA Twitter follower penetration levels for countries with higher 2020 CPI scores.
On the other hand, a very strong negative relationship was recorded between 2020 CPI scores and ACA Twitter follower penetration levels for countries with lower 2020 CPI scores. While the number of countries with lower 2020 CPI scores and Twitter pages was very small, the results demonstrate how the public may take an interest in social media posts from an ACA when prevailing corruption levels are relatively high.
2. Reporting activity
The availability of the following categories of key reports on ACA websites or on web pages of national government websites was examined:
- National Anti-Corruption Strategies
- ACA strategic plans
- ACA annual reports
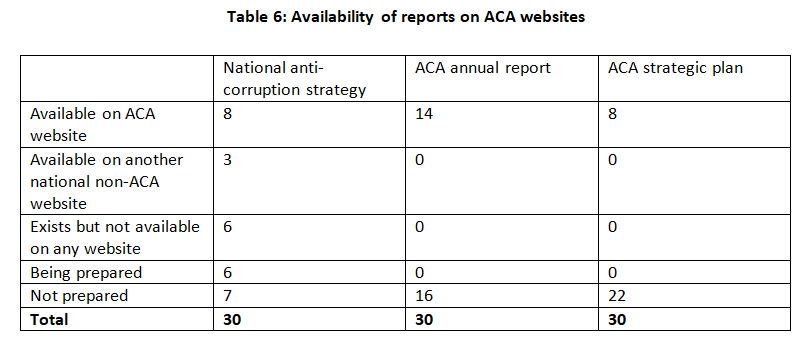
Details of the availability of the above reports on ACA websites as at early May 2021 are presented in Table 8.
Table 8: Availability of reports on ACA websites
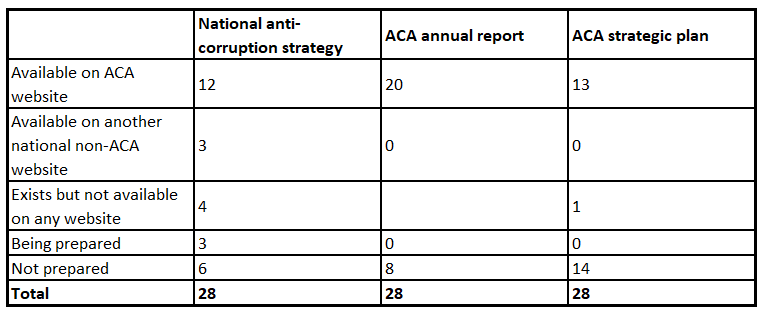
N.B. One Nigerian ACA with a website and the Ugandan ACA which only has social media sites are not included in Table 8.
Some publications that have become available recently on ACA websites for the above-mentioned report categories were examined to particularly review coverage of social media activity.
2.1 Publication of national anti-corruption strategies
Less than one-half of African ACAs with websites have published their respective national anti-corruption strategy (NACS) on their website.
NACS social media coverage
The recent Zimbabwe 2020-2024 NACS specifically identifies the use of social media in its awareness-raising campaigns on the nature and effects of corruption (Specific Objective 1.1) through the employment of social media in its educational communication strategy (Acton 1.1.5)
When discussing its objective of supporting the media (Specific Objective 1.5) the Zimbabwe NACS notes “The internet and various social media provide unprecedented opportunities of disseminating knowledge and increasing transparency across national borders in a timely fashion.”
It will be interesting to see whether the more detailed discussion of the use of social media employed in the Zimbabwe 2020-2024 NACS becomes the norm in future African NACS documents.
2.2 Publication of ACA annual reports
Coverage of digital platform activity in ACA annual reports remains generally modest.
ACA annual reports social media coverage
Madagascar’s Independent Anti-Corruption Office commented in its 2019 annual report that communication through digital media has been optimised to generate more support fight against corruption”.
Nigeria’s Independent Corrupt Practices and Other Related Offences Commission (ICPC) published details of its media coverage including social media in its 2019 annual report (see box below).
The Zimbabwe Anti-Corruption Commission (ZACC) in its 2019 annual report provided some detailed commentary on it social media activity. It noted that “In 2019, the Commission intensified publication and dissemination of anti-corruption information through a variety of media. In a commentary on a weekly television programme on Combating Corruption run in collaboration with a local TV station, the ZACC reported that recordings of the programme “were also posted on ZACC social media platforms Facebook and Twitter, where the public were further engaged and their comments and views taken on board”.
The ZACC also noted that its weekly television programme on Combating Corruption was consistent with article 13 of the UNCAC which reinforces the belief that States are best served when more information of public interest is made available to more people.
After providing references to social media activity in their 2018 annual reports, Ghana’s Commission on Human Rights and Administrative Justice (CHRAJ) and Kenya’s Ethics and Anti-Corruption Commission made no such references in their 2019 Annual Reports.
On balance, coverage of digital platform activity in ACA annual reports is gradually increasing.
2.3 Publication of ACA strategic plans
Less than one-half of African ACAs with websites have published their respective strategic plan on their website. The number of unpublished African ACA strategic plans is not known.
ACA strategic plans social media coverage
Recently published African ACA strategic plans have included social media related activities to support key ACA objectives.
For example Ghana’s Commission on Human Rights and Administrative Justice’s 2021-2025 5 Year Strategic Plan lists “Enhanced communication through CHRAJ website and social media handles” as the activity to support their objective of prioritising publication of CHRAJ under Output 1: Corporate affairs and visibility improved by 20% by 2025. The designated indicator for the latter activity is “Traffic on website and social media handles”. An accompanying budget figure has been presented.
Rwanda’s Office of the Ombudsman’s Strategic Plan 2020/2021-2023/2024 outlined the envisaged roles for its social media and website activity in its discussion of the implementation of its proposed communication and marketing plans, namely:
- “Media: The Office of the Ombudsman needs to maintain a permanent communication intended to awareness raising of the general public but also receiving feedback through different media channels including TV, Radios and newspapers, social media and digital billboards.
- Office of Ombudsman website shall be regularly updated with significant information about achievements, issues and expected contribution from various layers of the community in issues’ solving.”
South Africa’s Special Investigating Unit’s strategic plan 2020/21-2024/25 comments in its “Improving branding & communication” section that “The SIU will, amongst other things, focus on its public interface through the use of multi-media platforms for congruent and constant messaging for brand positioning characterised by independence, trustworthiness, success and integrity”.
The Zimbabwe Anti-Corruption Commission’s Strategic Plan 2020-2024 has provided for a separate social media related output (“Interactive website, email, social media, & twitter. Manned call centre & toll free”).
The recent increase in coverage of social media related activities in African ACA strategic plans is encouraging in view of current growth in social media use in Africa.
2.4 Overview of ACA online reporting activity
ACA reporting principles
The 2012 Jakarta Statement on Principles for Anti-Corruption Agencies set out sixteen principles to help ensure the independence and effectiveness of ACAs, as part of countries´ commitments and obligations under the United Nations Convention against Corruption (UNCAC). The latter principles include principles addressing public reporting (principle 15) and public communication and engagement (principle 16).
In 2020 UNODC published a “Commentary on the Jakarta statement on principles for anti-corruption agencies” which is intended to assist States parties and ACAs in ensuring that national anti-corruption frameworks are developed and strengthened in line with the UNCAC requirements.
Current African ACA reporting performance
On an overall basis, African ACA online reporting activity has, to date, not achieved the performance levels outlined in UNODC’s 2020 publication “Commentary on the Jakarta statement on principles for anti-corruption agencies” for the above-mentioned public reporting and public communication and engagement principles.
New IMF financial support arrangements to African countries which include the strengthening of anti-corruption frameworks could hasten improvements in African ACA online reporting in the near to medium-term.
Conclusions
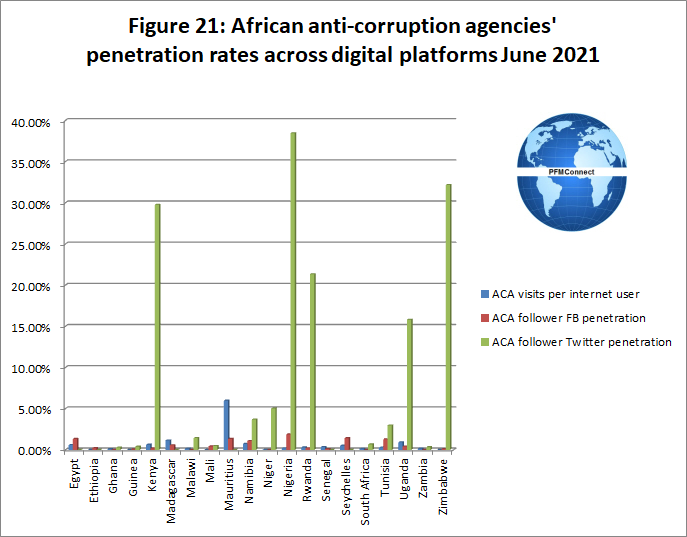
Public interest in the work of African ACAs continues to grow as demonstrated by the recent growth in Africa ACA social media follower numbers.
The majority of the 20 African ACAs that have recently used at least two digital platforms have though experienced greater interest being shown in their Facebook and Twitter pages rather than their websites. This data is presented in Figure 21.
Increased attention is being given to the role of social media in African NACS documents, ACA annual reports and ACA strategic plans. The current overall use of websites by African ACAs is, however, not significant while overall African ACA reporting activity has not yet achieved the levels suggested by UNODC in its 2020 “Commentary on the Jakarta statement on principles for anti-corruption agencies”.
There are currently significant opportunities for numerous African ACAs to expand their digital media activities:
- All ACAs should maintain websites on which to lodge key documents and provide anti-corruption advice to all sections of the public. This material can then be referred to in Facebook posts and tweets.
- All ACA websites should contain at a minimum: the national anti-corruption strategy, annual reports or strategic plans (if these are separate documents).
- Those African ACAs with existing websites but without either Facebook or Twitter pages and are located in countries with relatively high Facebook and/or Twitter subscriber penetration levels should make good this omission.
- The majority of African ACAs with existing Facebook and Twitter pages should increase their daily posting activity.
- The overall quality of content being posted to African ACA social media sites requires improvement in view of the prevailing weak correlation between social media posting volumes and follower engagement. This includes both clarity of message and use of video content.
Implementing the above actions will contribute to an increase in African ACA social media usage and engagement.
African ACA stakeholders can make an immediate non-financial contribution to the expansion of digital media use by African ACAs by actively encouraging ACAs to publish their key reports online and using their social media pages to explain their work and successes.
Development partners can also assist the expansion in use of digital platforms by African through targeted support of related training and development activities.
[1] John Leonardo is a PFM expert with extensive worldwide experience. He is a director of PFMConnect, a consultancy providing online support in the fields of public finance and digital communication.