Regional Caribbean SIDS PFM digital transparency update
Our June 2020 video “Improving PFM digital transparency in SIDS finance ministries” examined finance ministries (MoFs) use of digital platforms such as websites and social media to provide public financial management (PFM) related information in small island developing states (SIDS). Recent PFM digital transparency regional trends in Caribbean SIDS are examined in our “Regional Caribbean SIDS PFM digital transparency update” video.

Caribbean SIDS PFM digital transparency regional trends

PFM digital transparency trends were analysed for 18 Caribbean SIDS where MoF websites were active in the 2020 September quarter to provide the basis for this regional trends analysis:

  • Belize
  • Cayman Islands
  • Cuba
  • Curacao
  • Dominica
  • Dominican Republic
  • Grenada
  • Guyana
  • Haiti
  • Jamaica
  • Montserrat
  • Puerto Rico
  • Saint Lucia
  • St. Kitts & Nevis
  • St. Vincent & Grenadines
  • Suriname
  • Trinidad & Tobago
  • US Virgin Islands

Eleven Caribbean SIDS did not have active MoF websites in the 2020 September quarter. Although The Bahamas MoF did not have a standalone website, it does have an active Facebook page.

Charts for the following regional indicators are presented:

  • MoF website penetration levels for the 2020 March and September quarters. The figures used in these charts were obtained using a two-step process. Actual visit data for the March and September 2020 quarters was annualised to provide projections of estimated 2020 visits. The resulting 2020 annual MoF website visit projections were divided by the number of country internet users to obtain MoF website penetration levels.
  • Domestic and non-resident visits to MoF websites for the 2020 March and September quarters; these charts reflect the percentage of visits to MoF websites attributable to local residents and non-residents in the 2020 March and September quarters based on actual visit data.
  • Rates of change in MoF website visits; this data is based on changes to MoF visit levels between the 2020 March and September quarters. 
  • MoF Facebook penetration levels as at June 2020 and October 2020; these figures were obtained by dividing actual MoF Facebook follower numbers by the number of country Facebook subscribers.
  • Changes in Facebook follower numbers between June 2020 and October 2020; these charts reflect changes in the respective MoF Facebook follower numbers.
  • MoF Twitter penetration levels as at October 2020; these figures were obtained by dividing actual MoF Twitter follower numbers by the number of country Twitter subscribers.
  • Changes in Twitter follower numbers between June 2020 and October 2020; these charts reflect changes in the respective MoF Twitter follower numbers.

Key regional analysis findings

Some of the key findings from our analysis are as follows:

  • Estimated total Caribbean SIDS MoF 2020 visits in the 2020 September quarter were 11.07% higher than in the 2020 March quarter for the 12 MoFs where data was available for both quarters

  • Total Caribbean SIDS local resident MoF visits to the above-mentioned 12 MoF websites increased by 24.66% in the 2020 September quarter over the 2020 March quarter whilst total non-resident MoF visits fell by 30.98%

  • Caribbean SIDS MoF Facebook follower numbers (and overall Caribbean SIDS average MoF Facebook penetration levels) increased by 14.99% between June 2020 and October 2020 where comparative data was available

  • Caribbean SIDS MoF Twitter follower numbers (and overall Caribbean SIDS average MoF Twitter penetration levels) increased by 51.45% between June 2020 and October 2020 where comparative data was available

Regional Africa/Asia SIDS PFM digital transparency update

Our June 2020 video “Improving PFM digital transparency in SIDS finance ministries” examined finance ministries (MoFs) use of digital platforms such as websites and social media to provide public financial management (PFM) related information in small island developing states (SIDS). Recent PFM digital transparency regional trends in Africa and Asia (including the Middle East) SIDS are examined in our “Regional Africa/Asia SIDS PFM digital transparency update” video.

Africa/Asia SIDS PFM digital transparency regional trends

PFM digital transparency trends were analysed for 7 Africa/Asia SIDS where MoF websites were active in the 2020 September quarter to provide the basis for this regional trends analysis:

  • Bahrain
  • Cabo Verde
  • Maldives
  • Mauritius
  • Seychelles
  • Singapore
  • Timor-Leste

Three Africa/Asia SIDS did not have active MoF websites in the 2020 September quarter.

Charts for the following regional indicators are presented:

  • MoF website penetration levels for the 2020 March and September quarters. The figures used in these charts were obtained using a two-step process. Actual visit data for the March and September 2020 quarters was annualised to provide projections of estimated 2020 visits. The resulting 2020 annual MoF website visit projections were divided by the number of country internet users to obtain MoF website penetration levels.
  • Domestic and non-resident visits to MoF websites for the 2020 March and September quarters; these charts reflect the percentage of visits to MoF websites attributable to local residents and non-residents in the 2020 March and September quarters based on actual visit data.
  • Rates of change in MoF website visits; this data is based on changes to MoF visit levels between the 2020 March and September quarters. 
  • MoF Facebook penetration levels as at June 2020 and October 2020; these figures were obtained by dividing actual MoF Facebook follower numbers by the number of country Facebook subscribers.
  • Changes in Facebook follower numbers between June 2020 and October 2020; these charts reflect changes in the respective MoF Facebook follower numbers.
  • MoF Twitter penetration levels as at October 2020; these figures were obtained by dividing actual MoF Twitter follower numbers by the number of country Twitter subscribers.
  • Changes in Twitter follower numbers between June 2020 and October 2020; these charts reflect changes in the respective MoF Twitter follower numbers.

Key regional analysis findings

Some of the key findings from our analysis are as follows:

  • Estimated total Africa/Asia SIDS MoF 2020 visits in the 2020 September quarter were 11.53% higher than in the 2020 March quarter for the 6 MoFs where data was available for both quarters

  • Total Africa/Asia SIDS local resident MoF visits to the above-mentioned 6 MoF websites increased by 26.89% in the 2020 September quarter over the 2020 March quarter whilst total non-resident MoF visits fell by 29.17%

  • Africa/Asia SIDS MoF Facebook follower numbers (and overall Africa SIDS average MoF Facebook penetration levels) increased by 7.16% between June 2020 and October 2020 where comparative data was available

  • Africa/Asia SIDS MoF Twitter follower numbers (and overall Africa SIDS average MoF Twitter penetration levels) increased by 41.03% between June 2020 and October 2020 where comparative data was available


Global SIDS PFM digital transparency update

Our June 2020 video “Improving PFM digital transparency in SIDS finance ministries” examined finance ministries (MoFs) use of digital platforms such as websites and social media to provide public financial management (PFM) related information in small island developing states (SIDS). In this “Global SIDS PFM digital transparency update December 2020” video recent SIDS PFM digital transparency trends are examined on a regional and country basis.

Regional PFM digital transparency analysis

Global SIDS PFM digital transparency trends have been analysed using the following regional classifications for countries where MoF websites were active:

  • Africa/Asia/Middle East (7 countries)

  • Caribbean (18 countries)

  • Pacific (11 countries)

Non-active SIDS MoF websites in the 2020 September quarter in the above-mentioned regions were as follows:

  • Africa/Asia/MiddleEast (3 countries)

  • Caribbean (11 countries)

  • Pacific (8 countries)

Charts for the following indicators are presented:

  • MoF website penetration levels for the 2020 March and September quarters. The figures used in these charts were obtained using a two-step process. Actual visit data for the March and September 2020 quarters was annualised to provide projections of estimated 2020 visits. The resulting 2020 annual MoF website visit projections were divided by the number of country internet users to obtain MoF website penetration levels.

  • Domestic and non-resident visits to MoF websites for the 2020 March and September quarters; these charts reflect the percentage of visits to MoF websites attributable to local residents and non-residents in the 2020 March and September quarters based on actual visit data.

  • Rates of change in MoF website visits; this data is based on changes to MoF visit levels between the 2020 March and September quarters. 

  • MoF Facebook penetration levels as at June 2020 and October 2020; these figures were obtained by dividing actual MoF Facebook follower numbers by the number of country Facebook subscribers.

  • Changes in Facebook follower numbers between June 2020 and October 2020; these charts reflect changes in the respective MoF Facebook follower numbers.

  • MoF Twitter penetration levels as at October 2020; these figures were obtained by dividing actual MoF Twitter follower numbers by the number of country Twitter subscribers.

  • Changes in Twitter follower numbers between June 2020 and October 2020; these charts reflect changes in the respective MoF Twitter follower numbers.

The above-mentioned regional analyses are also available here:

  • Africa/Asia/Middle East

  • Caribbean

  • Pacific

Key regional analysis findings

Some of our key findings from the regional analysis are as follows:

  • Increases were recorded in SIDS overall regional MoF penetration scores for SIDS MoF websites, SIDS Facebook followers and SIDS Twitter followers. This growth is partially attributable to MoF posts relating to COVID-19 topics. 

  • A material increase in the SIDS Caribbean MoF Twitter follower penetration score contributed to strong growth in the SIDS overall regional Twitter follower penetration score.

  • The increased interest in MoF digital platforms also resulted in material increases in the proportion of MoF website visits attributable to local residents and a consequent reduction in the proportion of MoF website visits attributable to non-residents. This trend was particularly evident in the Pacific where there was strong growth in Papua New Guinea MoF local resident visits.

  • In four of the SIDS countries with MoF Facebook pages, the number of Facebook followers exceeded estimated 2020 MoF website visits demonstrating the role social media can play in boosting transparency about SIDS MoF activities.

SIDS country PFM digital transparency analysis

SIDS PFM digital transparency trends have also been analysed for the 36 countries examined in the above-mentioned regional analysis.

Country charts presenting the following PFM digital transparency indicators are available:

  • MoF website penetration levels for the 2020 September quarter. The figures used in these charts were obtained using a two-step process. Actual visit data for the September 2020 quarter was annualised to provide projections of estimated 2020 visits. The resulting 2020 annual MoF website visit projections were divided by the number of country internet users to obtain MoF website penetration levels.

  • Domestic and non-resident visits to MoF websites for the 2020 September quarter; these charts reflect the percentage of visits to MoF websites attributable to local residents and non-residents in the 2020 September quarter based on actual visit data.

  • MoF Facebook penetration levels as at October 2020; these figures were obtained by dividing actual MoF Facebook follower numbers by the number of country Facebook subscribers.

  • MoF Twitter penetration levels as at October 2020; these figures were obtained by dividing actual MoF Twitter follower numbers by the number of country Twitter subscribers.

Each country chart presents the following results for each indicator: the available country results, the average regional score and the average score for all SIDS countries where a MoF website was available.

Analyses of trends in key country PFM digital transparency indicators are also available here:

  • Africa/Asia/Middle East

  • Caribbean

  • Pacific


World e-government coverage remains limited

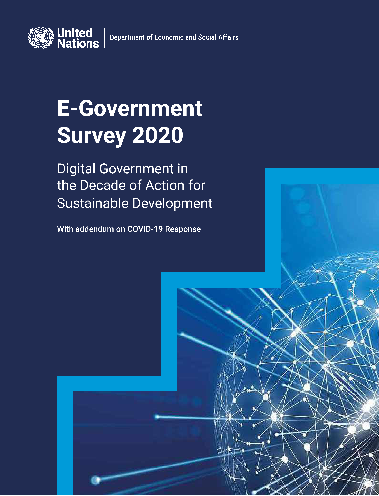
World e-government coverage remains limited according to the 2020 edition of the United Nations E‑Government Survey which was released on 10 July 2020 (1). This is in spite of most countries and municipalities currently pursuing digital government strategies, many with innovative initiatives.

The 2020 ranking of the 193 UN Member States in terms of digital government – capturing the scope and quality of online services, status of telecommunication infrastructure and existing human capacity – is led by Denmark, the Republic of Korea, and Estonia, followed by Finland, Australia, Sweden, the United Kingdom, New Zealand, the United States of America, the Netherlands, Singapore, Iceland, Norway and Japan.

Among the least developed countries, Bhutan, Bangladesh and Cambodia have become leaders in digital government development, advancing from the middle to the high E-Government Development Index (EGDI) group in 2020. Mauritius, the Seychelles, and South Africa are leading the e-government ranking in Africa. Overall, 65 per cent of Member States are at the high or very high EGDI level.

In responding to the health emergency, governments have put in place new tools, such as dedicated COVID-19 information portals, hackathons, e-services for supply of medical goods, virtual medical appointments, self-diagnosis apps and e-permits for curfews. Many countries were quick to deploy tracking and tracing apps, and apps for working and learning from home.

Innovative digital government responses to COVID-19 include online dashboards in Canada and Australia to share information and track emergency responses. In China, chatbots are used to assess patients’ risk of being infected. A community engagement app in Estonia allowed local governments to directly interact with their constituents, including through sharing COVID-19 information, posting photos and videos and even organizing virtual events. In Croatia, a “virtual doctor” is powered by artificial intelligence and developed by technology firms in cooperation with epidemiologists. In London, the use of cameras, sensors and AI algorithms, normally intended to control traffic, now measures distance between pedestrians to control social distance.

E-government progress still hindered by digital divide

As a development tool, the E-Government Survey examines countries’ strengths, challenges and opportunities, and informs policies and strategies. The 2020 edition found that progress has been made across all regions, even in the least developed countries. Over 22 per cent of countries were promoted to higher levels of e-government development.

Yet, despite the gains and major investments in e-government by many countries, the digital divide persists. Seven out of eight countries with low scores are in Africa and belong to the least developed countries group. The regional average index scores for countries in Africa are almost one third lower (at 0.3914) than the world average EGDI of 0.60.

Alongside these trends, the COVID-19 pandemic has now not only reinvigorated the role of digital government in its conventional delivery of public services and in ensuring business continuity, it has also brought about innovative ways in managing the crisis, such as in contact tracing, e-health, online learning, and remote working.

About the UN E-Government Survey

The UN E-Government Survey, published by the UN Department of Economic and Social Affairs (UN DESA), is prepared over a two-year period following an established methodology. It looks at how digital government can facilitate integrated policies and services across 193 UN Member States. The Survey supports countries’ efforts to provide effective, accountable and inclusive digital services to all and to bridge the digital divide and leave no one behind.

(1) This blog is an amended version of the accompanying UN press release