The road to improvement: governance indicators and socio-economic outcomes
A PFMConnect Study Report by David Fellows & John Leonardo

1. Introduction
In this study we look across a series of governance and outcome evaluation systems to assess the evidence for consistency within and between the two.
The main intention is to understand the extent to which progress in one field mirrors progress in others and consider what this may suggest about the drivers of the relationships observed, identifying any areas requiring further research.
Our work is based on the World Bank Governance Indicators (WBGIs) and a set of key Socio-economic Outcome Indicators (SEOIs) derived from the World Health Organisation (WHO) & United Nations Development Programme (UNDP) data sets. Data for 2004 (2005 for Health) and 2021 was derived from the 176 countries for which all necessary data was available. This is intended to provide a reasonable timespan and data sample for such an exercise. The one exception to this approach is in Table 5 (examining the relationship between female & male Expected Years of Schooling and GNIpc) where data from only 163 of the 176 counties is available.
Technical Note
Regression analysis is used throughout this study to determine the closeness of fit between the data being compared. For this we use Pearson coefficients (shown in the tables below) and r2 values. Given that we are interrogating data based on social behaviour we take a ‘satisfactory’ r2 value as being of between 0.4 and 0.5. This range is equivalent to Pearson coefficients of approximately 0.64 and 0.72. We therefore regard Pearson coefficients above 0.72 as ‘good’ and below 0.64 as ‘unsatisfactory’. All the correlations in this study exhibit P values < 5%. The results are coloured in the tables below, as follows: good; satisfactory; borderline unsatisfactory; and unsatisfactory.
2. World Bank Governance Indicators (WBGIs)
The WBGIs have 6 aspects: Voice and Accountability; Political Stability and absence of violence/terrorism; Government Effectiveness; Regulatory Quality; Rule of Law; and Control of Corruption (abbreviated in the tables below). In Tables 1 & 2 we examine the internal consistency of these data sets for the two chosen points in time (2004 and 2021).
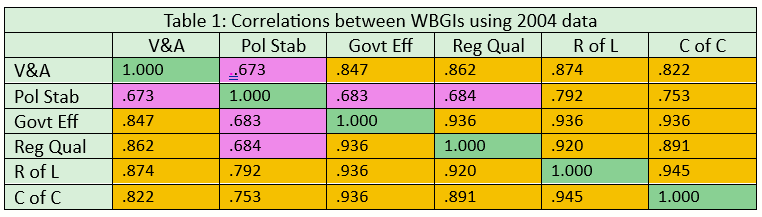
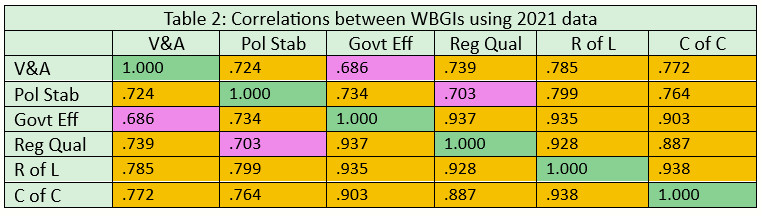
All elements of the WBGIs correlate well internally across the data sets for both periods. For 2004 data (Table1) Political Stability achieved the lowest performance with ‘satisfactory’ correlations across three variables (Voice and Accountability, Government Effectiveness; Regulatory Quality). For 2021 (Table 2) Political Stability had just one ‘satisfactory’ result (Regulatory Quality) with another ‘satisfactory’ result being obtained between Voice and Accountability and Government Effectiveness. All other results for both periods were ‘good’.
3. WHO and UNDP Socio-Economic Outcome Indicators (SEOIs)
The five key SEOIs chosen for this exercise cover a wide spectrum of personal and community development activities: Health; Human Development[1]; Life Expectancy; Expected Years of Schooling; and Gross National Income per capita. The Health indicator is compiled by the World Health Organisation and the others by the United Nations Development Programme. In Tables 3 & 4 we examine the internal consistency of these data sets for the two chosen points in time (2004 and 2021).
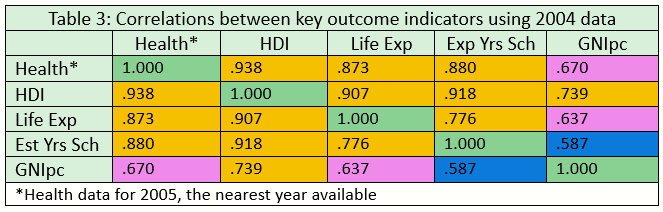

Each of the SEOIs correlate well internally across the two data sets for both periods. For 2004/5 (Table 3) GNIpc was rated ‘unsatisfactory’ against Expected Years of Schooling and ‘satisfactory’ against Health and Life Expectancy although in 2021 (Table 4) this performance improved to ‘satisfactory’ for Expected Years of Schooling and ‘good’ for Health and Life Expectancy. All other results for both periods were ‘good’.
4. Focus on female and male years of schooling
There is much work that we could do at both a broad and granular level with respect to both WBGI and SEOIs but for the moment we have chosen to examine the relationship between Expected Years of Schooling for females and males (EYS(f)/EYS(m)) and Gross National Income per capita for females and males (GNIpc(f)/GNIpc(m)) for 2004 and 2021 (Table 5). In doing this we use the same UNDP data source as for the material in section 3 above.
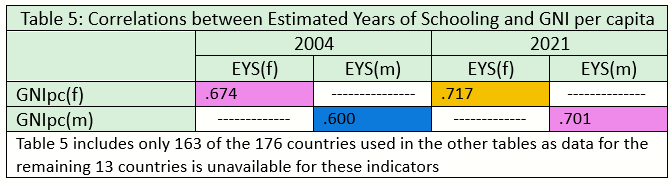
A recent IMF Blog stresses the importance of female participation in the labour market to improve the economic output of emerging and developing economies. Table 5 demonstrates that female schooling correlates well with female income generation. The lower correlation values for males could indicate that there are more diverse routes for males into economic activity making education a slightly more important route for the earning power of women although the male correlation improved from unsatisfactory to satisfactory between the two study periods, seemingly indicating an increased relevance of education to male earning capacity.
5. Examining the relationship between WBGIs and Outcomes
We next examined the relationships between WBGIs and SEOIs by correlating the WBGIs from section 2 and the SEOIs from section 3.

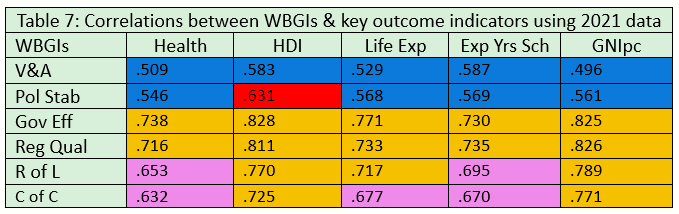
The analysis in Tables 6 & 7 demonstrates that four of the WBGIs (Government Effectiveness, Regulatory Quality, Rule of Law, Control of Corruption – termed here the ‘key’ WBGIs) correlate well with all the SEOIs included in this study for both the 2004/5 and 2021 data sets. For 2004/5 fourteen of these ‘key WBGI’ correlations are ‘good’ and six are ‘satisfactory’. For 2021 fifteen of these correlations are ‘good’ and five are ‘satisfactory’. Government Effectiveness is ‘good’ across all five SEOIs for both years. Political Stability appears at first sight to be the most consistently problematic across the two sets of correlations although all its correlations for the 2021 data set show improved Pearson coefficients for 2021 and one is borderline unsatisfactory. Voice and Accountability declines from three satisfactory and two unsatisfactory results for 2004/5 to five unsatisfactory results in 2021
6. The World Justice Programme – an approach to analysing performance standards
The World Justice Project, Rule of Law Index provides an accessible level of analysis of key governance characteristics (eg: absence of judicial corruption; accessibility and affordability of civil redress; effective criminal investigations) that assists consideration of their potential contribution to service improvement. The Rule of Law Index is not unique but it is impressive exemplar for the presentation of governance data.
The addition of organisational efficiency indicators within this framework could prove useful.
7. Discussion
Evidence from the internal analysis of World Bank Governance Indicators (Tables 1 & 2) and SEOIs (Tables 3 & 4) suggests that when one indicator from either of these data sets is executed well then the whole data set tends to be executed well and vice versa. The exception to this is the relationship between Expected Years of Schooling and GNI per capita in the 2004 data set (Table 3), although the 2021 result proves ‘satisfactory’ (Table 4).
‘Key WBGIs’ are mostly concerned with administrative and policy development tasks usually requiring broadly similar skill sets. Experiences in this field can be shared through regular contact in business meetings and client department project work.
Socio-economic activities are highly diverse in comparison to the tasks represented by the WBGIs. These activities are often highly customer-facing and require input from staff having many different backgrounds who do not often collaborate or even meet one another across service boundaries. The possibility of common levels of good or poor performance between socio-economic activities seems remote unless good standards of service performance are compared and developed across Government. The prevalence of satisfactory and good correlations amongst this data set seems particularly worthy of further consideration
The results of cross correlations between the ‘key WBGIs’ and the ‘SEOIs’ suggest that the ‘key WBGIs’ represent those activities that seem the most likely contributors to good socio-economic performance. In comparison, the WBGI ‘outliers’ (Voice & Accountability and Political Stability), although clearly preferable characteristics in their own right when realised to a high standard, do not seem to offer a consistent influence on good socio-economic public service delivery.
It could be argued that rather than the WBGIs driving the SEOIs, these data sets are driven by common factors such as national wealth, strength of democracy, uniformity of income distribution within the population or the quality of leadership at administrative or political level. So far we have established no such links and direct national leadership impact on a multitude of service delivery points seems improbable.
We note that the World Justice Project, Rule of Law Index offers an analytical format that could be applied to both governance and service performance. It could help equip individuals, community groups and governments to improve service outcomes at various levels.
Finally, female secondary education has many advantages but the particular advantage this study seems to suggest is that the education of females improves the wealth they generate. This result offers clear support for the economic arguments in favour of female education.
8. Conclusions
The outcomes from this study suggest that:
- WBGIs and SEOIs each have strong internal consistency of performance. From this it could be inferred that well organised administrations are likely to be well organised at a general level rather than as a series of independent activities. The issue is more remarkable in terms of SEOIs given that WBGIs could be regarded as mainly dependent on similar skill sets whereas this seems less likely in the case of SEOIs.
- The degree of compatibility between the four ‘key’ WBGIs and the SEOIs used in this study suggest that the ‘key’ governance indicators tend to influence the quality of service outcomes. Good governance, therefore, would seem to improve the quality of services, poor governance having an opposite effect.
- Our findings suggest that national leaders should consider the improvement of governance as a contribution to the improvement of service outcomes. The World Justice Project, Rule of Law Index provides an analytical format that could help in this process.
- The correspondence between female Expected Years of Schooling and female GNIpc provides powerful support for female education on economic grounds alone, confirming opinions already expressed by others.
PFMConnect is a public financial management consultancy with a particular interest in the use of digital communication to support learning and sharing expertise amongst the international development community.
David Fellows began his career in UK local government where he became President of the Society of Municipal Treasurers and a pioneer of digital government. He has held appointments in the UK Cabinet Office and the National Treasury of South Africa (david.fellows@pfmconnect.com).
John Leonardo is a PFM expert with extensive worldwide experience. He has undertaken PFM assignments in Africa, Asia, the Caribbean and the Pacific where he undertook PEFA assessments. Both authors are directors of PFMConnect, a public financial management consultancy (john.leonardo@pfmconnect.com).
[1] The Human Development (HDI) subset used in this study is a composite index developed by the UNDP that consists of: Life Expectancy, Expected Years of Schooling, GNIpc (all show separately here) plus Estimated Mean Years of Schooling.