Corruption in the Pacific (a US perspective)

Introduction

The United States State Department’s Country Reports on Human Rights Practices (“country reports”) strive to provide a factual and objective record on the status of human rights worldwide. The 2021 country reports were published on 12 April 2022. These are available for fifteen Pacific countries.

Section 4 of the country reports provides an assessment of “Corruption and Lack of Transparency in Government” which addresses the extent to which a country’s law provides criminal penalties for corruption by officials and the level of implementation of these laws.

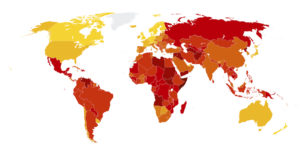
Transparency International in their 2021 Corruption Perceptions Index (CPI) report did not include these Pacific countries:

  • Kiribati
  • Marshall Islands
  • Micronesia
  • Nauru
  • Palau
  • Samoa
  • Tonga
  • Tuvalu

The country reports therefore provide some guidance on corruption in the Pacific countries not included in Transparency International’s 2021 Corruption Perceptions Index (CPI) report

Details of the overview comments for Pacific countries in the 2021 country reports are provided below.  

Australia

“The law provides criminal penalties for corruption by officials, and the government generally implemented these laws effectively. There were isolated reports of government corruption during the year.”

Fiji

“The law provides criminal penalties for corruption by officials, but the government did not implement the law effectively. There were numerous reports of government corruption.”

Kiribati

“The law provides criminal penalties for corruption by officials, but the government did not implement the law effectively. There were no reports of government corruption during the year. Officials sometimes engaged in corrupt practices with impunity.”

Marshall Islands

“The law provides criminal penalties for corruption by officials, and although the government generally implemented the law effectively, officials sometimes engaged in corrupt practices with impunity. Freedom House reported that corruption was a chronic problem, particularly in foreign aid allocation, government procurement, and transfers, and that high-ranking public officials were rarely prosecuted for corruption.”

Micronesia

“The law provides criminal penalties for corruption by officials, and the government generally implemented the law effectively, but some officials reportedly engaged in corrupt practices with impunity. There were numerous anecdotal reports of corruption.”

Nauru

“The law provides criminal penalties for corruption by officials, and the government generally implemented the law effectively. There were no reports of government corruption.”

New Zealand

“The law provides criminal penalties for corruption by officials, and the government generally implemented the law effectively. The Serious Fraud Office and police investigate corruption. Allegations of corruption can be reported anonymously, and the law protects employees who make a report relating to their employers. Agencies such as the Office of the Controller and Auditor General, and the Office of the Ombudsman independently report on and investigate state-sector activities, acting as watchdogs for public-sector corruption. Only parliament can remove individuals, who are known as officers of parliament, from these positions. Several investigations into alleged irregularities within national and local politics were underway.”

Palau

“Government corruption was a problem, and the government took some steps to address it. The law provides criminal penalties for corruption of and by officials. The Office of the Special Prosecutor, an independent entity, is authorized to prosecute all acts of corruption in the government. There were isolated reports of government corruption during the year.”

Papua New Guinea

“The law provides criminal penalties for corruption by officials; however, the government did not always implement the law effectively, and officials often engaged in corrupt practices with impunity. International civil society and human rights groups termed corruption “widespread” and “pervasive.” There were numerous reports of government corruption during the year. Corruption was so serious a problem in part due to weak public institutions and governance, lack of transparency, politicization of the bureaucracy, and the social pressure of traditional clan obligations. Corruption and conflicts of interest were of particular concern in extractive industries, particularly the logging sector, and in government procurement.”

Samoa

“The law provides criminal penalties for corruption by officials, and the government generally implemented the law effectively. The maximum penalty for corruption is 14 years’ imprisonment. There were isolated reports of government corruption during the year, mostly involving candidates for parliament offering bribes in exchange for votes. Officials infrequently engaged in corrupt practices with impunity. The law provides for an ombudsman to investigate complaints against government agencies, officials, or employees, including allegations of corruption. The ombudsman may require the government to provide information relating to a complaint. The Attorney General’s Office prosecutes criminal corruption cases on behalf of the Public Service Commission. The Ombudsman’s Office and the commission operated effectively. The Ombudsman’s Office included academics and other members of civil society among the members of its commissions of inquiry.”

Solomon Islands

“While the law provides criminal penalties for corruption by officials, the government implemented the law inconsistently, and officials sometimes engaged in corrupt practices with impunity. There were reports of government corruption during the year.”

Timor-Leste

“The penal code provides criminal penalties for corruption by officials. The government faced many problems in implementing the law, and the perception that officials frequently engaged in corrupt practices with impunity was widespread. The anticorruption commission (CAC) is charged with leading national anticorruption activities and has the authority to refer cases for prosecution; however, the CAC and the Prosecutor’s Office did not routinely cooperate with each other on investigations. Although the CAC is independent, the government controls its budget, making it vulnerable to political pressure. Institutions with the power and the competence to address corruption avoided investigations of politicians, government members, and leaders and veterans of the country’s independence struggle. The government undertook surprise inspections of government-run programs and increased pressure to implement asset-management and transparency systems.”

Tonga

“The law provides criminal penalties for corruption by officials, and the government generally implemented the law effectively. There were reports of government corruption during the year.”

Tuvalu

“The law provides criminal penalties for some forms of corruption by officials such as theft, and the government generally implemented the law effectively. There were no reports of government corruption during the year.”

Vanuatu

“The law provides criminal penalties for corruption by officials, and the government made some efforts to implement the law. Officials sometimes engaged in corrupt practices with impunity, and there were reports of government corruption.

The Office of the Ombudsman and the Auditor General’s Office are key government agencies responsible for combating government corruption.”

Conclusion

The laws in most Pacific countries provide relatively robust criminal penalties for corruption by officials.

The above-mentioned country reports, however, reveal there are currently significant variations in Pacific government efforts to implement legislation covering criminal penalties for corruption.  


Regional Pacific SIDS PFM digital transparency update

Our June 2020 video “Improving PFM digital transparency in SIDS finance ministries” examined finance ministries (MoFs) use of digital platforms such as websites and social media to provide public financial management (PFM) related information in small island developing states (SIDS). Recent PFM digital transparency regional trends in Pacific SIDS are examined in our “Regional Pacific SIDS PFM digital transparency update” video.

Pacific SIDS PFM digital transparency regional trends

PFM digital transparency trends were analysed for 11 Pacific SIDS where MoF websites were active in the 2020 September quarter to provide the basis for this regional trends analysis:

  • Cook Islands
  • Fiji
  • Kiribati
  • Marshall islands
  • Micronesia
  • Northern Marianas
  • Papua New Guinea
  • Samoa
  • Tonga
  • Tuvalu
  • Vanuatu

Seven Pacific SIDS did not have active MoF websites in the 2020 September quarter.

Charts for the following regional indicators are presented:

  • MoF website penetration levels for the 2020 March and September quarters. The figures used in these charts were obtained using a two-step process. Actual visit data for the March and September 2020 quarters was annualised to provide projections of estimated 2020 visits. The resulting 2020 annual MoF website visit projections were divided by the number of country internet users to obtain MoF website penetration levels.
  • Domestic and non-resident visits to MoF websites for the 2020 March and September quarters; these charts reflect the percentage of visits to MoF websites attributable to local residents and non-residents in the 2020 March and September quarters based on actual visit data.
  • Rates of change in MoF website visits; this data is based on changes to MoF visit levels between the 2020 March and September quarters. 
  • MoF Facebook penetration levels as at June 2020 and October 2020; these figures were obtained by dividing actual MoF Facebook follower numbers by the number of country Facebook subscribers.
  • Changes in Facebook follower numbers between June 2020 and October 2020; these charts reflect changes in the respective MoF Facebook follower numbers.

Currently, no Pacific SIDS MoFs maintain Twitter accounts.

Key regional analysis findings

Some of the key findings from our analysis are as follows:

  • Estimated total Pacific SIDS MoF 2020 visits in the 2020 September quarter were 13.10% higher than in the 2020 March quarter for the 10 MoFs where data was available for both quarters

  • Total Pacific SIDS local resident MoF visits to the above-mentioned 10 MoF websites increased by 375% in the 2020 September quarter over the 2020 March quarter whilst total non-resident MoF visits fell by 50%

  • Pacific SIDS MoF Facebook follower numbers (and overall Pacific SIDS average MoF Facebook penetration level) increased by 41.31% between June 2020 and October 2020


Global SIDS PFM digital transparency update

Our June 2020 video “Improving PFM digital transparency in SIDS finance ministries” examined finance ministries (MoFs) use of digital platforms such as websites and social media to provide public financial management (PFM) related information in small island developing states (SIDS). In this “Global SIDS PFM digital transparency update December 2020” video recent SIDS PFM digital transparency trends are examined on a regional and country basis.

Regional PFM digital transparency analysis

Global SIDS PFM digital transparency trends have been analysed using the following regional classifications for countries where MoF websites were active:

  • Africa/Asia/Middle East (7 countries)

  • Caribbean (18 countries)

  • Pacific (11 countries)

Non-active SIDS MoF websites in the 2020 September quarter in the above-mentioned regions were as follows:

  • Africa/Asia/MiddleEast (3 countries)

  • Caribbean (11 countries)

  • Pacific (8 countries)

Charts for the following indicators are presented:

  • MoF website penetration levels for the 2020 March and September quarters. The figures used in these charts were obtained using a two-step process. Actual visit data for the March and September 2020 quarters was annualised to provide projections of estimated 2020 visits. The resulting 2020 annual MoF website visit projections were divided by the number of country internet users to obtain MoF website penetration levels.

  • Domestic and non-resident visits to MoF websites for the 2020 March and September quarters; these charts reflect the percentage of visits to MoF websites attributable to local residents and non-residents in the 2020 March and September quarters based on actual visit data.

  • Rates of change in MoF website visits; this data is based on changes to MoF visit levels between the 2020 March and September quarters. 

  • MoF Facebook penetration levels as at June 2020 and October 2020; these figures were obtained by dividing actual MoF Facebook follower numbers by the number of country Facebook subscribers.

  • Changes in Facebook follower numbers between June 2020 and October 2020; these charts reflect changes in the respective MoF Facebook follower numbers.

  • MoF Twitter penetration levels as at October 2020; these figures were obtained by dividing actual MoF Twitter follower numbers by the number of country Twitter subscribers.

  • Changes in Twitter follower numbers between June 2020 and October 2020; these charts reflect changes in the respective MoF Twitter follower numbers.

The above-mentioned regional analyses are also available here:

  • Africa/Asia/Middle East

  • Caribbean

  • Pacific

Key regional analysis findings

Some of our key findings from the regional analysis are as follows:

  • Increases were recorded in SIDS overall regional MoF penetration scores for SIDS MoF websites, SIDS Facebook followers and SIDS Twitter followers. This growth is partially attributable to MoF posts relating to COVID-19 topics. 

  • A material increase in the SIDS Caribbean MoF Twitter follower penetration score contributed to strong growth in the SIDS overall regional Twitter follower penetration score.

  • The increased interest in MoF digital platforms also resulted in material increases in the proportion of MoF website visits attributable to local residents and a consequent reduction in the proportion of MoF website visits attributable to non-residents. This trend was particularly evident in the Pacific where there was strong growth in Papua New Guinea MoF local resident visits.

  • In four of the SIDS countries with MoF Facebook pages, the number of Facebook followers exceeded estimated 2020 MoF website visits demonstrating the role social media can play in boosting transparency about SIDS MoF activities.

SIDS country PFM digital transparency analysis

SIDS PFM digital transparency trends have also been analysed for the 36 countries examined in the above-mentioned regional analysis.

Country charts presenting the following PFM digital transparency indicators are available:

  • MoF website penetration levels for the 2020 September quarter. The figures used in these charts were obtained using a two-step process. Actual visit data for the September 2020 quarter was annualised to provide projections of estimated 2020 visits. The resulting 2020 annual MoF website visit projections were divided by the number of country internet users to obtain MoF website penetration levels.

  • Domestic and non-resident visits to MoF websites for the 2020 September quarter; these charts reflect the percentage of visits to MoF websites attributable to local residents and non-residents in the 2020 September quarter based on actual visit data.

  • MoF Facebook penetration levels as at October 2020; these figures were obtained by dividing actual MoF Facebook follower numbers by the number of country Facebook subscribers.

  • MoF Twitter penetration levels as at October 2020; these figures were obtained by dividing actual MoF Twitter follower numbers by the number of country Twitter subscribers.

Each country chart presents the following results for each indicator: the available country results, the average regional score and the average score for all SIDS countries where a MoF website was available.

Analyses of trends in key country PFM digital transparency indicators are also available here:

  • Africa/Asia/Middle East

  • Caribbean

  • Pacific


Regional historical trends in CPI 2012-2017

Transparency International released their Corruption Perceptions Index 2017 on 22 February 2018. Whilst historical trends in CPI index scores for 2012-2017 for each country are also presented, the 2012-2017 historical scores have not been separately presented on a regional basis to allow a quick comparison of country corruption scores within each of the six regions used in the analysis (Americas, Asia Pacific, Eastern Europe & Central Asia, MENA, Sub-Saharan Africa and Western Europe).

We have reorganised the spreadsheet provided by Transparency International to provide a listing of the reported historical trends in index scores for 2012-2017 for countries in each of the six regions. Our spreadsheet is available here.