By David Fellows and John Leonardo[1]
Background on Papua New Guinea (PNG)
Papua New Guinea (PNG) is a lower-middle-income economy heavily dependent upon commodity exports. It has an extremely diverse social structure with fierce clan loyalties, characteristics that provide severe challenges to the effective working of government that have not yet been successfully addressed.[2] [3]The country’s social development[4] trails its economic status. Overall, the performance of the PNG public sector is weak, the lower tiers of government are dysfunctional and corruption is rife.
Key findings of PNG’s latest PEFA assessment
The latest PNG Public Expenditure and Financial Accountability (PEFA) assessment completed in August last year has been published. Scores for the various public financial management (PFM) performance indicators (PIs) were determined using both a new so-called “testing” methodology and the existing 2011 methodology. Details of the scores are available in this spreadsheet and a summary of the new testing methodology scores are given at the end.
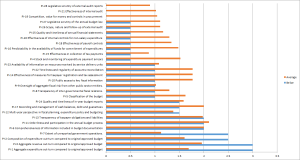
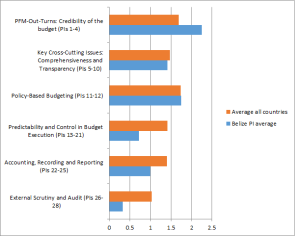
The PEFA exercise gives ranking for about 30 criteria on a scale from A to D. In the 2015 assessment, A and B scores represented a very disappointing 17% of all PI scores applying the new testing methodology or 18% using the 2011 methodology. Nine out of the ten scores under the two key headings of ‘Predictability & Control in Budget Execution’ and ‘Accounting, Recording and Reporting’ were ‘D’ or ‘D+’. In many cases financial regulations and improvements recommended by internal audit review were simply not observed reflecting perhaps a mixture of poor oversight, inadequate training, lack of basic ability and blatant disregard for proper practice.
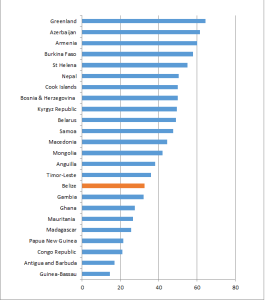
Twenty-four PEFA assessments have been completed since 1 January 2014 and published by the PEFA Secretariat. (In addition, six completed assessments have not been published to date.) As the graph in Figure 1 below shows, Papua New Guinea’s overall score was ranked 21st out of the twenty-four countries. (Details are available here, including our methodology to derive aggregate scores from PEFA rankings.) Only Congo Republic, Antigua and Barbuda and Guinea-Bissau recorded lower overall scores than Papua New Guinea.
Figure 1: Aggregate PEFA scores for 24 countries
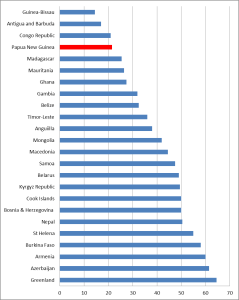
Note: The PEFA scores are aggregated by us using a methodology set out in the spreadsheet mentioned above. The highest possible score is 84.
PNG is also one of the poorest countries rated, but its overall performance is weaker than some other even poorer developing countries as set out in Table 1 below.
Table 1: PEFA scores sorted by Gross National Income (GNI) per capita (US$)
|
GNI per capita 2014 |
HDI* 2014 |
PEFA score |
| Papua New Guinea |
2,463 |
0.505 |
21.5 |
| Nepal |
2,311 |
0.548 |
50.5 |
| Burkina Faso |
1,591 |
0.402 |
58 |
| Gambia |
1,507 |
0.441 |
32 |
| Madagascar |
1,328 |
0.510 |
25.5 |
*Human Development Index
What is also disturbing is the suggestion that financial management in PNG has worsened. Two earlier PEFA exercises have been carried out for PNG, in 2005 and 2009. While these have not been released, we know from the ADB’s Country Operations Business Plan 2015-2017 that in 2009 32% of PIs were scored an A or a B. The fall from 32% to 18% suggests a major deterioration in public financial management in PNG. (The 2005 methodology used in 2009 and the 2011 methodology used in 2015 are not identical, but sufficiently similar for this comparison to be made.)
The IMF team observes that PNG’s budget process is orderly and well understood, and that some progress has been made in embedding the medium-term dimension into fiscal planning. The aggregate credibility of the budget appears satisfactory though only with some serious caveats. Most of the 2015 report, however, contains a damning indictment of financial administration: control over budget execution is weak; there are high levels of variance between budget and expenditure; expenditure control is weak; project implementation is weak; budgets contain insufficient analytical detail; many bank reconciliations are not carried out in a timely manner and contain significant unresolved items; the coverage and classification of in-year data does not allow comparison with original approved budgets; many state owned enterprises receive very poor audit reports; there is no overall PFM reform strategy; and much else besides.
In our recent blog “Proposals for PEFA reform”, we remarked on the failure of the PEFA methodology to come to terms with fundamental institutional weaknesses. The PNG assessment contains a short section on institutional factors but fails to establish the root causes of the perceived deficiencies. The remedies proposed – including the use of a longer time span, creating a more structured approach and the formation of a Ministerial steering committee – are worthy but unequal to the task of addressing the long list of recommended priority improvements that end the report.
Readers of the report are left asking for an explanation of underlying reasons for this catalogue of critical deficiencies, the lack of progress made and the decline in standards in some areas.
PNG’s response
The PNG government has made no formal response to the latest PEFA assessment but the recent Budget Speech contains reforms concerning state-owned enterprises, Government Finance Statistics and debt management that partially address material weaknesses identified in the latest PEFA assessment. There were no specific initiatives to promote increased accountability in PFM activities in either the 2016 Budget Speech or supporting volumes.
The government’s stated expectation in the 2016 Budget that the 2015 PEFA assessment “should provide confidence to development partners to gradually rely on government systems” (Vol. 1, p. 46) appears optimistic to say the least.
Following the completion of the PEFA assessment the IMF and the Government of PNG created a “road map” for public financial management (PFM) reform. This is referred to in the IMF 2015 Article IV report, but has not been published, as far as we can tell. It seems to have been designed to give effect to the extensive list of priority reforms identified in the 2015 PEFA assessment but the published fragments are lacking in explanation about how these improvements are to be achieved. It was not, as far as we are aware, created out of any form of extensive public or corporate consultation.
Conclusions
PFM reform is not an end in itself nor can it be achieved in isolation from the broader condition of a fragile state. Good PFM is, however, an essential component of policy development, service and project implementation, obtaining value-for-money, promoting economic development, fighting corruption and providing public accountability.
Clearly, financial management in PNG is in a parlous state. No significant progress has been made in most PFM activities at government level in recent years; indeed there is evidence of regress.
The failure to publish previous PEFA reports has denied both the tax payers and the people of PNG with any real appreciation that the resources expended on PFM enhancement activities have generally failed to produce material overall improvements in key PFM areas. A stance must now be taken by international development agencies that all future work in relation to the reform of PFM in PNG must be undertaken in a much more transparent manner. A good start would be to publish the road map.
There is an opportunity for progress with a Finance Minister, James Marape, committed to reform and a Finance Secretary, Dr Ken Ngangan, who is well-respected and capable. However, the effort, to be successful, must go beyond a small number of individuals. We suggest that, given the relative failure of reform activity to-date, there should be an open assessment of the public financial management reform challenges and their root causes involving the full range of stakeholders. This should result in an agreed set of objectives, reform processes, expected performance levels and timescales designed to deliver feasible and desirable improvements in administrative practice, governance and political relationships to achieve an acceptable minimum overall PFM standard. External agencies should require evidence of extensive support from the government of PNG as a condition of continued participation in the reforms. A collective approach to the problems of PNG involving Government and development partners could provide added value from the future resources deployed by all parties.
Unlikely though the achievement of these proposals may seem, donors must now ask themselves what purposes further reform activities are expected to serve if they choose to ignore their lack of results. The ADB country plan for PNG expected the proportion of As and Bs to rise from 32% in 2009 to 50%[5] in 2015. Instead, it has fallen to 18%.
As we have said before, the PEFA methodology can no longer ignore the need to identify the root causes of poor PFM in fragile states. PNG seems to offer a perfect case in point.
APPENDIX PNG 2015 PEFA Scores (using “testing” methodology)
| PFM Pillars |
Performance Indicator (PIs) Scores* |
| A |
B |
C |
D |
| Credibility of Fiscal Strategy (PI:1-3) |
1 |
1 |
|
1 |
| Comprehensiveness and Transparency (PI:4-9) |
|
2 |
1 |
3 |
| Asset & Liability Management (PI:10-13) |
|
|
|
4 |
| Policy-based Planning & Budgeting (PI:14-18) |
|
1 |
2 |
2 |
| Predictability and Control in Budget Execution (PI:19-25) |
|
|
1 |
6 |
| Accounting, Recording and Reporting (PI:26-28) |
|
|
|
3 |
| External Scrutiny and Audit (PI:29-30) |
|
|
|
2 |
| Total scores |
1 |
4 |
4 |
21 |
*each column includes ‘+’ scores, so ‘D’; includes D and D+
[1] The authors are Principals of PFMConnect. They have been engaged on projects in Africa, Asia and the Pacific funded by major development partners. A slightly abbreviated version of this blog is available at the Devpolicy Blog of the Development Policy Centre based at the Australian National University’s Crawford School of Public Policy.
[2] The three Political Economies of electoral quality in PNG & Solomon Islands by T. Wood ANU DevPolicy Centre
[3] Political Governance & Service Delivery in the Western Highland Province, PNG by J. Ketan ANU ISSN: 1328-7854
[4] Asian Development Bank Country Partnership Strategy Papua New Guinea 2016–2020, March 2015, page 1
[5] This was an objective included in ADB’s Country Operations Business Plan 2015-2017 “Updated Country Partnership Strategy Results Framework” published in October 2014. This document was superseded by ADB’s Country Operations Business Plan 2016-2018, published in March 2015, from which this objective was omitted

