Corruption Correlations

Corruption Correlations

Our blog “International Development and the Challenge of Public Sector Corruption” discusses the results of our examination of correlations for the control of corruption and government effectiveness and public financial management (PFM) performance.

Corruption and Government Effectiveness

Correlations were calculated for the relationships between the control of corruption (capturing perceptions of the extent to which public power is exercised for private gain) and government effectiveness (including the quality of public services) for 184 countries using data from the World Bank’s 2013 Worldwide Governance Indicators (WGI), together with World Bank 2013 per capita income data and Rand Corporation’s Trace (bribery) Matrix risk scores for these countries.

The Trace (bribery) Matrix risk scores have an inverse relationship with corruption control levels i.e. low Trace Matrix risk scores indicate relatively favourable levels of control over corruption whilst high Trace Matrix risk scores indicate relatively poor control over corruption. Strong relationships between WGI control over corruption /government effectiveness scores and Trace Matrix risk scores will result in relatively high negative correlation values.

Results were prepared for the total sample of 184 countries as well as the halves and quartiles of the sample.

Corruption and Public Financial Management

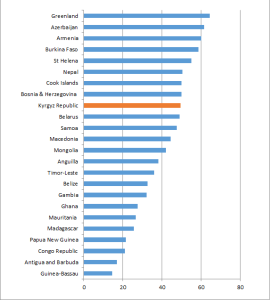
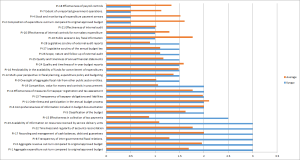
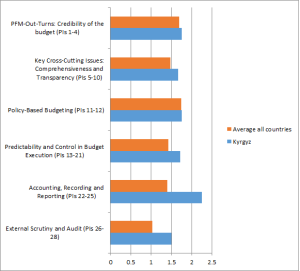
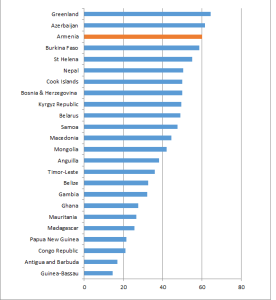
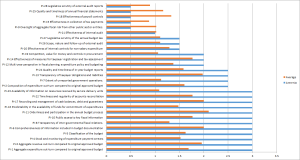
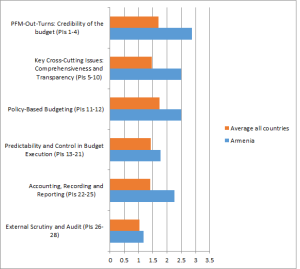
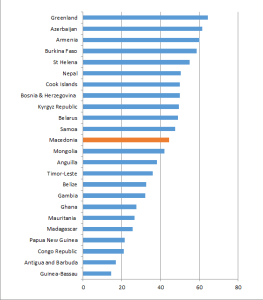
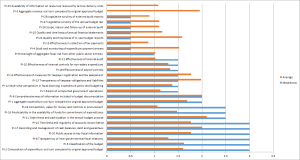
Correlations were calculated for the relationships between some measures of PFM performance and the measures of corruption and government effectiveness for the 39 developing countries for which Public Expenditure and Financial Accountability (PEFA) assessments were made available during the past three years from 2013 to 2015. The respective PFM performance measures used are performance indicators prescribed in the PEFA methodology applicable in 2011 comprising the initial 2005 indicator set and subsequent amendments.

Results were also prepared for this sample of 39 countries as well as the halves and quartiles of the sample.

Correlations download

The correlations are presented in a spreadsheet that can be downloaded here.


Kyrgyzstan Public Financial Management Profile

Kyrgyzstanmap

Introduction

This note presents a series of charts which provide an overview of Kyrgyzstan’s recent public financial management (PFM) performance based on this country’s 2015 Public Expenditure and Financial Accountability (PEFA) assessment. Comparisons are made between Kyrgyzstan’s performance and the performance of the other twenty-three countries that had PEFA assessments published in 2014-2015. All analyses have been prepared using results reported from using the 2011 PEFA methodology.

Overall PFM performance

Individual country PFM performance has been determined by applying the following points scale to reported individual performance indicator (PI) scores as presented in Table 1. No points were allocated to PIs that were not scored because either data was unavailable, a D score was given or the PI was not applicable.

Table 1: PI scoring methodology

PEFA PI score

Points allocated

A

3

B+

2.5

B

2

C+

1.5

C

1

D+

.5

D

0

The graph in Figure 1 below shows Kyrgyzstan’s overall score was ranked ninth out of the twenty-four countries.

 Figure 1: Aggregate PEFA scores for 24 countries

Kyrgyz overall result

Details of the distribution of overall country scores across PFM performance categories, as determined by PFMConnect, are presented in Table 2. Kyrgyzstan’s overall score was 49.5 points.

Table 2: Distribution of country PFM performance levels

PFM performance Overall Scores Number of countries
Very strong 66.37-84 0
Strong 49.57-66.36 8
Moderate 32.77-49.56 7
Weak 15.97-32.76 8
Very weak 0-15.96 1
Total 24

Kyrgyzstan’s overall PFM performance is classified as “moderate”.

PI performance

The graph in Figure 2 below shows the scores for Kyrgyzstan individual PIs compared with the average score recorded for each PI across the twenty-four PEFA assessments we have studied.

 Figure 2: Kyrgyzstan PI score comparisons

Kyrgyz relative performance PIs

Download a pdf version of Figure 2 here (Kyrgyzstan PIs) to review individual PI scores in more detail.

Twenty-eight PIs were assessed. Nineteen PIs had scores above the country average, one PI had a score equal to the country average whilst eight PIs had scores below the country average.

Performance across key PFM activities

The graph in Figure 3 below shows the average scores for the six key PFM activities compared with the average score recorded for these activities across the twenty-four country PEFA assessments we have studied.

 Figure 3: Kyrgyzstan key PFM activity comparisons

Kyrgyz - relative performance for key PFM activities

All six key PFM activities recorded scores above the country average.

PEFA ASSESSMENT

You can download the 2015 PEFA assessment for Kyrgyzstan here.


Armenia Public Financial Management Profile

Armenia_Map

Introduction

This note presents a series of charts which provide an overview of Armenia’s recent public financial management (PFM) performance based on this country’s 2014 Public Expenditure and Financial Accountability (PEFA) assessment. Comparisons are made between Armenia’s performance and the performance of the other twenty-three countries that had PEFA assessments published in 2014-2015. All analyses have been prepared using results reported from using the 2011 PEFA methodology.

Overall PFM performance

Individual country PFM performance has been determined by applying the following points scale to reported individual performance indicator (PI) scores as presented in Table 1. No points were allocated to PIs that were not scored because either data was unavailable, a D score was given or the PI was not applicable.

Table 1: PI scoring methodology

PEFA PI score

Points allocated

A

3

B+

2.5

B

2

C+

1.5

C

1

D+

.5

D

0

The graph in Figure 1 below shows Armenia’s overall score was ranked 3rd out of the twenty-four countries.

 Figure 1: Aggregate PEFA scores for 24 countries

Armenia overall result

Details of the distribution of overall country scores across PFM performance categories, as determined by PFMConnect, are presented in Table 2. Armenia’s overall score was 60 points.

Table 2: Distribution of country PFM performance levels

PFM performance Overall Scores Number of countries
Very strong 66.37-84 0
Strong 49.57-66.36 8
Moderate 32.77-49.56 7
Weak 15.97-32.76 8
Very weak 0-15.96 1
Total 24

Armenia’s overall PFM performance is classified as “strong”.

PI performance

The graph in Figure 2 below shows the scores for Armenia’s individual PIs compared with the average score recorded for each PI across the twenty-four PEFA assessments we have studied.

 Figure 2: Armenia PI score comparisons

Armenia relative performance PIs

Download a pdf version of Figure 2 here (Armenia PIs) to review individual PI scores in more detail.

Twenty-eight PIs were assessed. Twenty-two PIs had scores above the country average whilst six PIs had scores below the country average.

Performance across key PFM activities

The graph in Figure 3 below shows the average scores for the six key PFM activities compared with the average score recorded for these activities across the twenty-four country PEFA assessments we have studied.

 Figure 3: Armenia key PFM activity comparisons


Armenia - relative performance for key PFM activities

All six key PFM activities recorded scores above the country average.

PEFA ASSESSMENT

You can download the 2014 PEFA assessment for Armenia here.


Macedonia Public Financial Management Profile

Macedonia map

Introduction

This note presents a series of charts which provide an overview of Macedonia’s recent public financial management (PFM) performance based on this country’s 2015 Public Expenditure and Financial Accountability (PEFA) assessment. Comparisons are made between Macedonia’s performance and the performance of the other twenty-three countries that had PEFA assessments published in 2014-2015. All analyses have been prepared using results reported from using the 2011 PEFA methodology.

Overall PFM performance

Individual country PFM performance has been determined by applying the following points scale to reported individual performance indicator (PI) scores as presented in Table 1. No points were allocated to PIs that were not scored because either data was unavailable, a D score was given or the PI was not applicable.

Table 1: PI scoring methodology

PEFA PI score

Points allocated

A

3

B+

2.5

B

2

C+

1.5

C

1

D+

.5

D

0

The graph in Figure 1 below shows Macedonia’s overall score was ranked tenth out of the twenty-four countries.

 Figure 1: Aggregate PEFA scores for 24 countries

Macedonia overall result

Details of the distribution of overall country scores across PFM performance categories, as determined by PFMConnect, are presented in Table 2. Macedonia’s overall score was 44.5 points.

Table 2: Distribution of country PFM performance levels

PFM performance Overall Scores Number of countries
Very strong 66.37-84 0
Strong 49.57-66.36 8
Moderate 32.77-49.56 7
Weak 15.97-32.76 8
Very weak 0-15.96 1
Total 24

Macedonia’s overall PFM performance is classified as “moderate”.

PI performance

The graph in Figure 2 below shows the scores for Macedonia individual PIs compared with the average score recorded for each PI across the twenty-four PEFA assessments we have studied. Please note that no score was recorded for the top two indicators in Figure 2 as these indicators (PI-3 and PI-23) were given D scores.

 Figure 2: Macedonia PI score comparisons

Macedonia relative performance PIs

Download a pdf version of Figure 2 here (Macedonia PIs) to review individual PI scores in more detail.

Twenty-eight PIs were assessed. Fifteen PIs had scores above the country average, one PI had a score equal to the country average whilst twelve PIs had scores below the country average.

Performance across key PFM activities

The graph in Figure 3 below shows the average scores for the six key PFM activities compared with the average score recorded for these activities across the twenty-four country PEFA assessments we have studied.

 Figure 3: Macedonia key PFM activity comparisons


Macedonia - relative performance for key PFM activities

Three key PFM activities recorded scores above the country average whilst three key PFM activities recorded scores below the country average.

PEFA ASSESSMENT

You can download the 2015 PEFA assessment for Macedonia here.