By David Fellows and John Leonardo
Introduction
The Public Expenditure and Financial Accountability (PEFA) programme provides a framework for assessing and reporting the strengths and weaknesses of public financial management (PFM). The current 2016 Framework refines the previous 2011 Framework and is structured under a hierarchy of 6 Pillars, 31 Indicators (PIs) and 94 Dimensions. The PEFA Field Guide explains the components of the 2016 Framework and describes how an assessment team should score each dimension on a scale of A to D, a D score representing the lowest level of performance.
An initial assessment of the latest PEFA reports for countries published under the 2016 Framework suggested that many countries were not getting the PFM basics right. This led to a comparison of recent results with those from earlier PEFA reports prepared under the 2011 Framework to examine performance over time and the lessons for PFM improvement that such a comparison may offer (termed the ‘dual study’). It was decided to focus on dimension scores since the demands of PFM can change markedly depending on the aspects of the subject matter under consideration and the evident variations of score for the same country at dimension level within a range of PIs.
It was decided to confine this initial study to the analysis of D scores at the dimension level given the frequency of D scores, the very poor performance they represent and the importance of raising performance to a higher level. The Field Guide requires a D score when: ‘the feature being measured is present at less than the basic level of performance or is absent altogether, or that there is insufficient information to score the dimension’.
For the purpose of this study, D scores include dimensions marked D*, NR and some NA scores where evidence suggests a breakdown in PFM activity. It seemed evident that these attributions are often applied inconsistently and serve to obscure the extent of the poor performance of some countries by avoiding the use of justifiable D scores. A summary of all scores for the 2016 Framework and the dual study evaluations, as discussed in this report, can be accessed at Annex 1.
2016 Framework analysis
The 2016 Framework analysis consisted of the latest published evaluations for the 63 countries for which there were published reports at the time of this study. The D scores represent 32% of all dimension scores in this data set, 39% amongst low-income countries.
D scores were widely distributed throughout the framework with 45 of the 94 dimensions having an above average number of D scores.
The study also defined and assessed the key factors (termed descriptors) that contributed to PFM performance. The results, summarised at Annex 2, suggested that most D scores can be explained by the absence of ‘Management Effectiveness’, ‘Integrity’ and in one case of ‘High Level Technical Knowledge’ although poor “System Design” was another potentially important contributing factor.
Annex 3 provides a full list of the 2016 Framework dimensions and D score data together with the descriptors contributing to each dimension.
Dual framework
Following the results of the 2016 Framework D score study it was decided to undertake a review of 45 countries that have undertaken at least one PEFA evaluation under both the 2011 and 2016 frameworks (the earliest and the latest studies we used for countries with more than two studies). This enabled a country’s performance to be compared over a five-year period.
The 2011 and 2016 PEFA frameworks differ in many respects. An equivalence table published by PEFA suggests that the two frameworks can be aligned to 37 “equivalent” dimensions on the basis that the respective dimensions were either “directly comparable” or “indirectly comparable”.
The PEFA equivalence table identifies 28 dimensions (or in some cases subsets) from the 2011 framework as “non-comparable (subject only)” to 2016 counterparts suggesting that the dimension descriptions and scoring routines differ markedly while the general area of relevance to the dimensions are similar. This leaves only 37 pairs of comparable dimensions.
On examination, the study team decided that 26 of the 28 pairs of dimensions judged “non-comparable (subject only)” were in fact very similar to the 2016 counterparts, the main difference being the way in which the later guidance is translated into clear-cut scoring criteria but that a good PEFA evaluator should have made reasonably similar judgements for both frameworks when reviewing all but two of these dimensions.
This exercise, therefore, recognises 63 equivalent dimensions while also providing results for PEFA’s 37 equivalent dimensions. It is suggested that the D score characteristics of both data sets are sufficiently similar to provide a reasonable validation for the larger 63 dimension equivalence thereby extending the usefulness of inter-framework comparisons. Details of the PEFA and PFMConnect equivalence tables are set out at Annex 4. The dual study of 2016 and 2011 Framework with D score data at dimension level is set out at Annex 5.
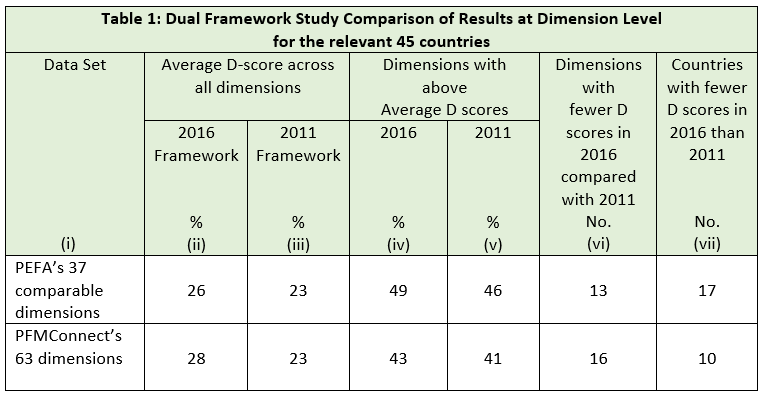
The dual study is highly concerning in terms of the lack of improvement amongst those dimensions receiving D scores. These data are further summarised and commented on below.

The dual framework study reveals a deteriorating performance with most dimensions exhibiting a greater number of D scores in the later evaluations. Only 13 (35%) of dimensions from the 37 dimensions study and 16 (25%) from the 63 dimensions study experienced reductions in D scores between evaluations.
When the dual evaluations for the same country were compared, see Annex 6, it was noted that most countries recorded a higher proportion of D scores for the same dimension in both evaluations demonstrating a reasonably consistent poor performance. A few countries displayed less consistent results.
Few countries in the 63 dimensions set recorded reductions in the number of D scores in 2016 framework results compared with the 2011 framework results. The top performers where significant PFM reform activities had been undertaken between the dual framework studies included: Philippines, Maldives, Mongolia and Tajikistan.

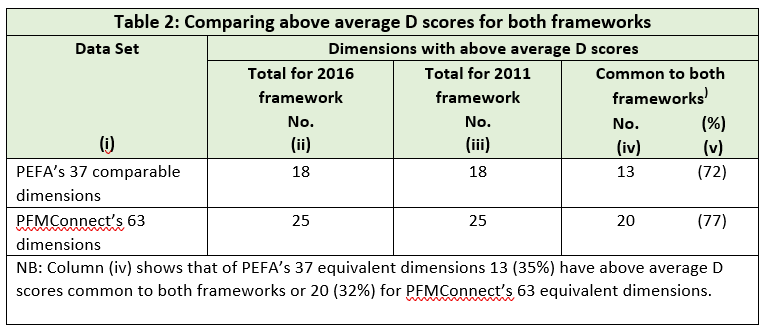
The results for the proportion of dimensions with above-average D scores that are common to both framework dimensions sets is concerning. Approximately one third of all dimensions had above-average D scores that were common to both frameworks for the same country for both datasets. In addition, over 70% of the above-average dimensions in both datasets were common to both frameworks showing limited improvement in the worst scoring areas over a five-year period.
Dimensions with regular poor performance are widely distributed (titles in red at Annex 6). This suggests pockets of poor management that remain in place without effective challenge and this is consistent with the descriptor analysis.
Conclusions
This study offers a range of findings that pose questions about the approach, effectiveness and sustainability of PFM reforms instituted by national and subnational governments often in collaboration with development agencies. The concerns about management effectiveness and integrity highlighted in this study must be seen to question the most basic aspects of any organisation.
The study focusses on D score analysis, but it could be useful to extend the analysis to C-level scores where the performance of countries still remains below good international standards. This could reveal new characteristics of national PFM performance and extend the range of analytical techniques applied to performance data.
The data analysis evidences the credibility of PFMConnect’s extended 63 dimension equivalence model that offers significant potential for more detailed studies of specific countries or regions.
Further work on descriptors to reveal contributory factors to variations in performance seems worthy of further development.
The failure of some governments to publish PEFA studies in full reinforces concerns about the need for greater attention to integrity. Another improvement that could be readily and widely implemented is legislative scrutiny of audit reports (PI 31).
Recommendations
We recommend that country-specific studies should be undertaken based on PEFA assessment reports (both 2016 Framework studies for the full 94 dimensions and dual studies where the data are available) examining D scores at dimension level to establish potential causes of poor performance and identify ways in which performance may be improved. Issues to consider with respect to areas of poor performance, include:
- The commitment to personnel development and support, including: in-service training, management development, oversight, feedback on performance, and system design.
- The adequacy of transparency and accountability and evidence of corrupt activity.
- The quality of relevant communication and support levels among different departments and units of the finance ministry.
- The reasons for persistently poor or erratic performance and the fit with other findings.
- The observations of managers and staff on reasons for poor performance and barriers to improvement.
We recommend that country studies should be designed as the initial phase of PFM development programmes. In this context, a report by the Swedish International Development Cooperation Agency (SIDA) offers some observations about the conditions for effective PFM reform. These include the importance of change agendas being aligned with Government priorities and the need to treat PFM reform as a learning process with strong emphasis on coordination and systematic evaluation of the activities performed by teams responsible for delivery.
Groups of countries or subnational bodies may wish to collaborate in reform programmes enabling challenges and learning to be shared and systems of mutual support developed. We have previously advocated the use of digital communication as a cost-effective and time-saving way of sharing knowledge and ideas between nations (incl. expert advisors).
Any country, region or development institution wishing to participate in further work in this field is invited to discuss their interest with the authors.
An article based on this study has been published by the IMF’s PFM Blog.
PFMConnect is a public financial management consultancy with a particular interest in the use of digital communication to support learning and sharing expertise amongst the international development community.
David Fellows began his career in UK local government where he became President of the Society of Municipal Treasurers and a pioneer of digital government. He has held appointments in the UK Cabinet Office and the National Treasury of South Africa (david.fellows@pfmconnect.com).
John Leonardo is a PFM expert with extensive worldwide experience. He has undertaken PFM assignments in Africa, Asia, the Caribbean and the Pacific where he undertook PEFA assessments. Both authors are directors of PFMConnect, a public financial management consultancy (john.leonardo@pfmconnect.com).


