Digital Media, Transparency and the War Against Corruption

Posted by David Fellows and John Leonardo[1]

Corruption is highly damaging to economic and social life through misappropriation of public funds, restriction of open market activity, favouritism towards families of those in power, and the many detrimental effects of rent seeking. In this piece we review evidence for the power of transparency to reduce corruption and improve economic performance. We then consider the increasing relevance of digital media, particularly social media, to the transparency agenda and how its application can be encouraged.

Economic performance, transparency and corruption

The IMF’s‘ Framework for Enhanced Fund Engagement’ 2018 noted that (i) transparency is significantly correlated with a perceptions-based indicator of the control of corruption; (ii) higher levels of corruption are typically correlated with lower growth; and (iii) corruption and governance are significantly associated with average long-run per capita growth, investment, and revenue. The IMF’s Fiscal Monitor: Curbing Corruption (April 2019 edition) shows that the least corrupt governments can collect considerably more in taxes than those at the same level of economic development. In a blog announcing this guidance Christine Lagarde, then Managing Director of the IMF, affirmed the importance of transparency by commenting that; ‘At the end of the day, the most durable “cure” for corruption is strong, transparent, and accountable institutions’.

How governments may involve digital media

The World Bank DocumentEnhancing Government Effectiveness and Transparency: The Fight Against Corruption’ (September 2020) details studies in which developing countries have sought to combat corruption by improving transparency.

It instances:

  • The identification of corruption relating to infrastructure projects in Columbia by the Government urging citizens to publicize unfinished projects.
  • The introduction of participatory budgeting in Brazil where one study found that adopter municipalities achieved a 39% higher tax collection than those that had not.
  • The use of Beneficial Ownership declarations in the Ukraine where online access to records promises significant advantages following a chequered introductory experience.
  • Public reporting of Supreme Audit Institution (SIA) findings in Ghana, and India’s practice of encouraging the public to comment on SIA reports and provide evidence of misdeeds.

These are all public engagement activities that can most readily be undertaken via digital media.

The impact of social media

Social media is a growing phenomenon across the developing world. It can be used by governments to encourage citizens to make their views known (figures in million).

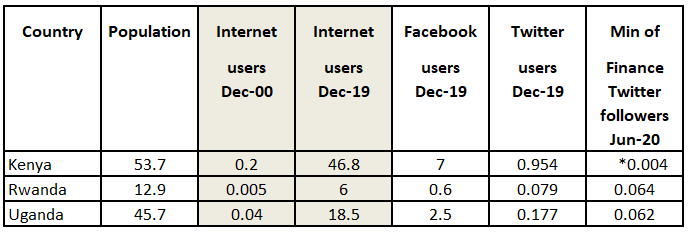
 Note: *Kenya’s Anti-Corruption Agency has 293,000 Twitter followers

A survey of Kenyan social media users conducted by SIMELab in 2020 suggested that social media use was becoming highly age specific.

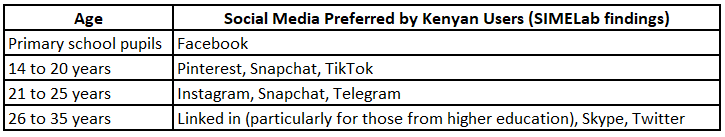
The survey identified the three most used media as WhatsApp (89%), Facebook (82%) and YouTube (58%). TIFA Research has identified Facebook as the current most effective advertising platform.

The African public accountability movement Connected Development (CODE) based in Nigeria uses digital media to help marginalised communities monitor public service investment employing its ‘follow the money’ slogan. A current focus is COVID-19 expenditure.

We have analysed the correlation between Transparency International’s 2019 CPI scores for the 48 best performing African Countries included in the index where both Facebook and Twitter services were available. There are strong positive correlations between social media user numbers and perceived corruption levels. This result seems consistent with the transparency/corruption relationship found in the IMF Framework for Enhanced Fund Engagement, reflecting public interest in government affairs and corruption.

A growing relationship between formal digital media and social media

Over the past year online news media have reported government initiatives against corruption and investigated acts of corruption. Two examples:

  • On 11th November 2020 the Cyprus Mail commented that: ‘without (greater) public support, anti-corruption groups are unlikely to attain their objectives, because the politicians will have no reason to take any notice of them’.
  • On 21st November 2020ABS-CBN News reported that a task force investigating Philippine Government corruption led by Justice Secretary Menardo Guevarra had received at least 60 complaints during the previous two weeks.

These causes could benefit from social media use by community activists (Cyprus) and the government (Philippines).

Conclusions

The economic impact of the COVID-19 pandemic on developing countries brings the prospect of reduced national resources unless and until these countries can address their corruption challenges. 

Formal online media have helped increase transparency in recent times. Further, social media is fast becoming an important form of popular communication throughout the developing world. The targeted use of social media platforms presents an effective opportunity for online public engagement that makes messaging easy to assimilate and respond to.

Governments can use social media to seek public support for reporting anti-corruption activities, complaining about unfair decisions and exposing the accumulation of unexplained wealth by politicians and officials. Such engagement is, however, dependent on the demonstration of government integrity, the recognition of public priorities, and the provision of basic information on services and funding to local communities.

The international development community can encourage governments to uphold press freedom, protect whistle-blowers and use social media as part of the transparency process, and scale up its support to countries that are pursuing effective anti-corruption policies.

A supporting video is available here.

[First published by IMF PFM Blog 7thJanuary 2021]


[1] David Fellows is an international development PFM advisor who previously worked extensively in UK local government finance and in the Cabinet Office. He was a leader for the introduction of digital communication in UK public service delivery. John Leonardo is a PFM expert with extensive worldwide experience. They are both directors of PFMConnect, a consultancy providing online support in the fields of public finance and digital communication (david.fellows@pfmconnect.com).


Regional Pacific SIDS PFM digital transparency update

Our June 2020 video “Improving PFM digital transparency in SIDS finance ministries” examined finance ministries (MoFs) use of digital platforms such as websites and social media to provide public financial management (PFM) related information in small island developing states (SIDS). Recent PFM digital transparency regional trends in Pacific SIDS are examined in our “Regional Pacific SIDS PFM digital transparency update” video.

Pacific SIDS PFM digital transparency regional trends

PFM digital transparency trends were analysed for 11 Pacific SIDS where MoF websites were active in the 2020 September quarter to provide the basis for this regional trends analysis:

  • Cook Islands
  • Fiji
  • Kiribati
  • Marshall islands
  • Micronesia
  • Northern Marianas
  • Papua New Guinea
  • Samoa
  • Tonga
  • Tuvalu
  • Vanuatu

Seven Pacific SIDS did not have active MoF websites in the 2020 September quarter.

Charts for the following regional indicators are presented:

  • MoF website penetration levels for the 2020 March and September quarters. The figures used in these charts were obtained using a two-step process. Actual visit data for the March and September 2020 quarters was annualised to provide projections of estimated 2020 visits. The resulting 2020 annual MoF website visit projections were divided by the number of country internet users to obtain MoF website penetration levels.
  • Domestic and non-resident visits to MoF websites for the 2020 March and September quarters; these charts reflect the percentage of visits to MoF websites attributable to local residents and non-residents in the 2020 March and September quarters based on actual visit data.
  • Rates of change in MoF website visits; this data is based on changes to MoF visit levels between the 2020 March and September quarters. 
  • MoF Facebook penetration levels as at June 2020 and October 2020; these figures were obtained by dividing actual MoF Facebook follower numbers by the number of country Facebook subscribers.
  • Changes in Facebook follower numbers between June 2020 and October 2020; these charts reflect changes in the respective MoF Facebook follower numbers.

Currently, no Pacific SIDS MoFs maintain Twitter accounts.

Key regional analysis findings

Some of the key findings from our analysis are as follows:

  • Estimated total Pacific SIDS MoF 2020 visits in the 2020 September quarter were 13.10% higher than in the 2020 March quarter for the 10 MoFs where data was available for both quarters

  • Total Pacific SIDS local resident MoF visits to the above-mentioned 10 MoF websites increased by 375% in the 2020 September quarter over the 2020 March quarter whilst total non-resident MoF visits fell by 50%

  • Pacific SIDS MoF Facebook follower numbers (and overall Pacific SIDS average MoF Facebook penetration level) increased by 41.31% between June 2020 and October 2020


Regional Caribbean SIDS PFM digital transparency update

Our June 2020 video “Improving PFM digital transparency in SIDS finance ministries” examined finance ministries (MoFs) use of digital platforms such as websites and social media to provide public financial management (PFM) related information in small island developing states (SIDS). Recent PFM digital transparency regional trends in Caribbean SIDS are examined in our “Regional Caribbean SIDS PFM digital transparency update” video.

Caribbean SIDS PFM digital transparency regional trends

PFM digital transparency trends were analysed for 18 Caribbean SIDS where MoF websites were active in the 2020 September quarter to provide the basis for this regional trends analysis:

  • Belize
  • Cayman Islands
  • Cuba
  • Curacao
  • Dominica
  • Dominican Republic
  • Grenada
  • Guyana
  • Haiti
  • Jamaica
  • Montserrat
  • Puerto Rico
  • Saint Lucia
  • St. Kitts & Nevis
  • St. Vincent & Grenadines
  • Suriname
  • Trinidad & Tobago
  • US Virgin Islands

Eleven Caribbean SIDS did not have active MoF websites in the 2020 September quarter. Although The Bahamas MoF did not have a standalone website, it does have an active Facebook page.

Charts for the following regional indicators are presented:

  • MoF website penetration levels for the 2020 March and September quarters. The figures used in these charts were obtained using a two-step process. Actual visit data for the March and September 2020 quarters was annualised to provide projections of estimated 2020 visits. The resulting 2020 annual MoF website visit projections were divided by the number of country internet users to obtain MoF website penetration levels.
  • Domestic and non-resident visits to MoF websites for the 2020 March and September quarters; these charts reflect the percentage of visits to MoF websites attributable to local residents and non-residents in the 2020 March and September quarters based on actual visit data.
  • Rates of change in MoF website visits; this data is based on changes to MoF visit levels between the 2020 March and September quarters. 
  • MoF Facebook penetration levels as at June 2020 and October 2020; these figures were obtained by dividing actual MoF Facebook follower numbers by the number of country Facebook subscribers.
  • Changes in Facebook follower numbers between June 2020 and October 2020; these charts reflect changes in the respective MoF Facebook follower numbers.
  • MoF Twitter penetration levels as at October 2020; these figures were obtained by dividing actual MoF Twitter follower numbers by the number of country Twitter subscribers.
  • Changes in Twitter follower numbers between June 2020 and October 2020; these charts reflect changes in the respective MoF Twitter follower numbers.

Key regional analysis findings

Some of the key findings from our analysis are as follows:

  • Estimated total Caribbean SIDS MoF 2020 visits in the 2020 September quarter were 11.07% higher than in the 2020 March quarter for the 12 MoFs where data was available for both quarters

  • Total Caribbean SIDS local resident MoF visits to the above-mentioned 12 MoF websites increased by 24.66% in the 2020 September quarter over the 2020 March quarter whilst total non-resident MoF visits fell by 30.98%

  • Caribbean SIDS MoF Facebook follower numbers (and overall Caribbean SIDS average MoF Facebook penetration levels) increased by 14.99% between June 2020 and October 2020 where comparative data was available

  • Caribbean SIDS MoF Twitter follower numbers (and overall Caribbean SIDS average MoF Twitter penetration levels) increased by 51.45% between June 2020 and October 2020 where comparative data was available


Regional Africa/Asia SIDS PFM digital transparency update

Our June 2020 video “Improving PFM digital transparency in SIDS finance ministries” examined finance ministries (MoFs) use of digital platforms such as websites and social media to provide public financial management (PFM) related information in small island developing states (SIDS). Recent PFM digital transparency regional trends in Africa and Asia (including the Middle East) SIDS are examined in our “Regional Africa/Asia SIDS PFM digital transparency update” video.

Africa/Asia SIDS PFM digital transparency regional trends

PFM digital transparency trends were analysed for 7 Africa/Asia SIDS where MoF websites were active in the 2020 September quarter to provide the basis for this regional trends analysis:

  • Bahrain
  • Cabo Verde
  • Maldives
  • Mauritius
  • Seychelles
  • Singapore
  • Timor-Leste

Three Africa/Asia SIDS did not have active MoF websites in the 2020 September quarter.

Charts for the following regional indicators are presented:

  • MoF website penetration levels for the 2020 March and September quarters. The figures used in these charts were obtained using a two-step process. Actual visit data for the March and September 2020 quarters was annualised to provide projections of estimated 2020 visits. The resulting 2020 annual MoF website visit projections were divided by the number of country internet users to obtain MoF website penetration levels.
  • Domestic and non-resident visits to MoF websites for the 2020 March and September quarters; these charts reflect the percentage of visits to MoF websites attributable to local residents and non-residents in the 2020 March and September quarters based on actual visit data.
  • Rates of change in MoF website visits; this data is based on changes to MoF visit levels between the 2020 March and September quarters. 
  • MoF Facebook penetration levels as at June 2020 and October 2020; these figures were obtained by dividing actual MoF Facebook follower numbers by the number of country Facebook subscribers.
  • Changes in Facebook follower numbers between June 2020 and October 2020; these charts reflect changes in the respective MoF Facebook follower numbers.
  • MoF Twitter penetration levels as at October 2020; these figures were obtained by dividing actual MoF Twitter follower numbers by the number of country Twitter subscribers.
  • Changes in Twitter follower numbers between June 2020 and October 2020; these charts reflect changes in the respective MoF Twitter follower numbers.

Key regional analysis findings

Some of the key findings from our analysis are as follows:

  • Estimated total Africa/Asia SIDS MoF 2020 visits in the 2020 September quarter were 11.53% higher than in the 2020 March quarter for the 6 MoFs where data was available for both quarters

  • Total Africa/Asia SIDS local resident MoF visits to the above-mentioned 6 MoF websites increased by 26.89% in the 2020 September quarter over the 2020 March quarter whilst total non-resident MoF visits fell by 29.17%

  • Africa/Asia SIDS MoF Facebook follower numbers (and overall Africa SIDS average MoF Facebook penetration levels) increased by 7.16% between June 2020 and October 2020 where comparative data was available

  • Africa/Asia SIDS MoF Twitter follower numbers (and overall Africa SIDS average MoF Twitter penetration levels) increased by 41.03% between June 2020 and October 2020 where comparative data was available