Public financial management weaknesses can lead to corruption
Mauritania’s experience

Global corruption trends
Two recent reports on Global corruption trends highlight a number of states facing serious challenges and our analysis indicates some interesting links between corruption and standards of public financial management.
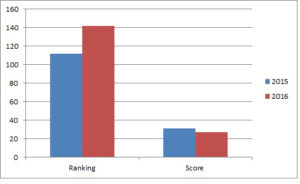
Transparency International’s recently released 2016 Corruption Perceptions Index for 2016 indicates that Mauritania’s ranking deteriorated noticeably in 2016 compared to the previous year. The full data set for all 176 countries is available here and the Mauritanian data is shown at Figure 1.
Figure 1: Transparency International Corruption Perceptions Index Mauritania results 2015-2016
The World Economic Forum’s 2016 Global Competitiveness Survey, released on 15 September 2016, included the results of their annual Executive Opinion Survey which aims to measure critical concepts affecting the business environment such as the incidence of corruption. This survey shows that Mauritania was ranked 124th out of the 138 countries for corruption. The World Economic Forum’s 2016 Global Competitiveness Survey report is available here.
We have developed a spreadsheet showing (i) the country rankings for the World Economic Forum’s Executive Opinion Survey (not publicly available) and reported corruption impediment scores and (ii) a comparison of the Transparency International and World Economic Forum survey results that are available for 125 countries. Contact us if you would like to receive a copy of our spreadsheet.
We have found that there is a significant overall negative correlation between the scores in the two surveys (a Pearson coefficient of -.78).
Mauritania’s poor PFM and poor corruption performance
Mauritania’s corruption rankings in both surveys are relatively poor with scores falling in the bottom 20% of the two surveys. Many developing countries, including Mauritania, face significant challenges in addressing corruption. We have previously identified a wide range of actions that governments (as well as the private sector) could take to assist in reducing corruption levels that include improving a range of public financial management practices in our blog International Development and the Challenge of Public Sector Corruption.
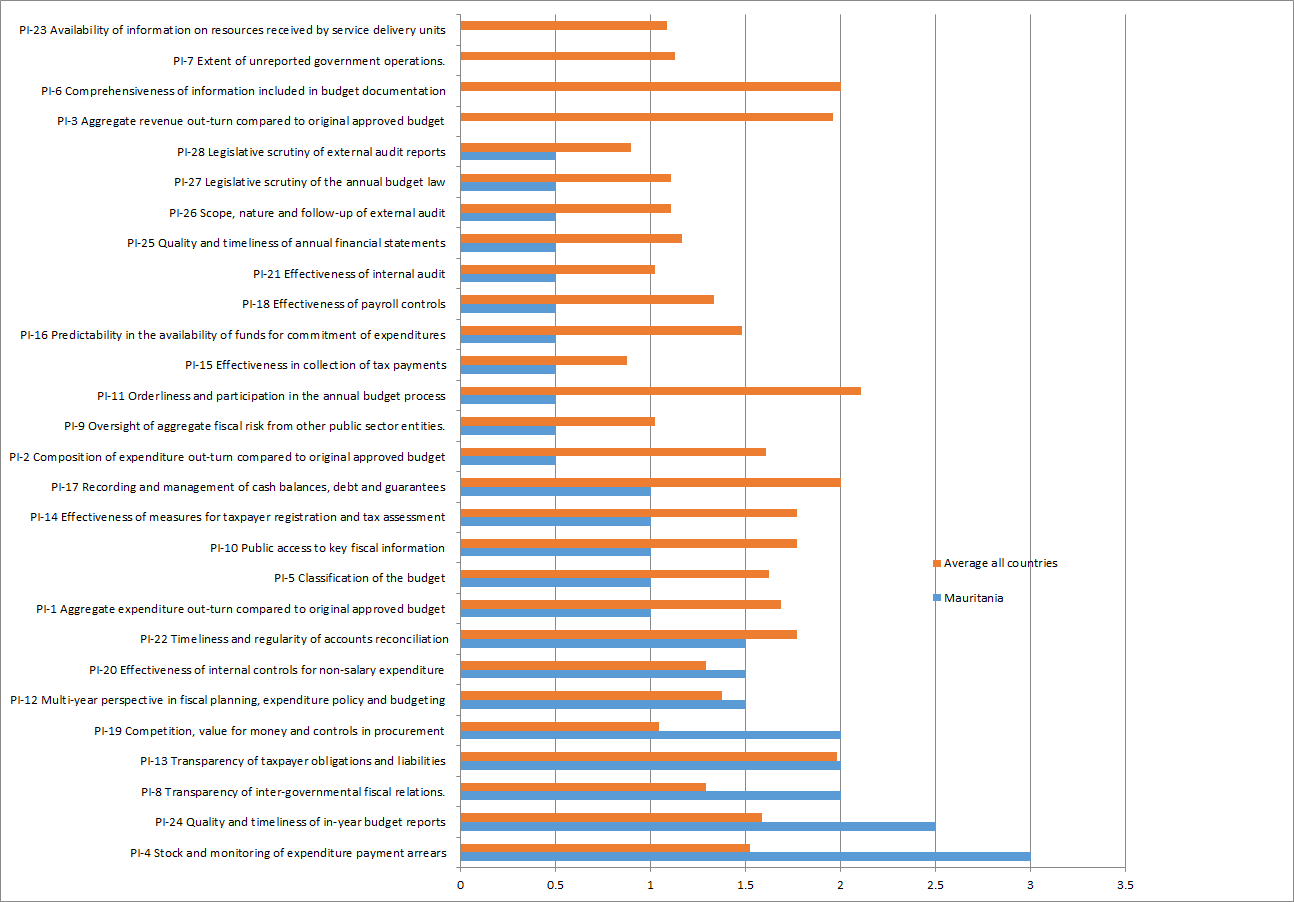
Last year we examined the Public Expenditure and Financial Accountability (PEFA) results of the twenty-four countries, including Mauritania,that published PEFA assessments during 2013-2015. Nine of the twenty-four countries studied, including Mauritania, had PEFA results indicating relatively weak public financial management; Mauritania was ranked 19th out of the twenty-four countries studied using a scoring system that the IMF has previously employed. Mauritania recorded relatively poor scores in a number of key PFM activities that are important in reducing corruption including payroll controls, internal audit, financial reporting and external audit; details are shown at Figure 2; this chart can be viewed in more detail here.
Figure 2: Mauritania PEFA indicators’ relative performance

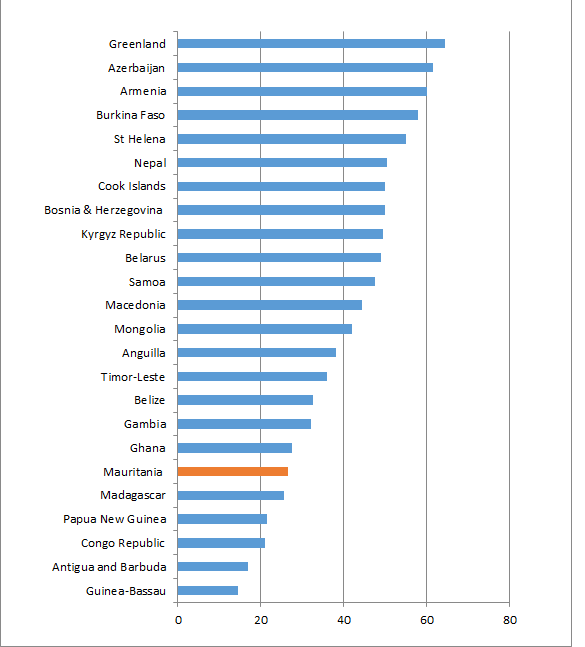
Seventeen of the above-mentioned twenty-four countries feature in Transparency International’s 2016 Corruption Perceptions Index. Sixteen countries (Ghana is the exception) recorded below –average scores in TI’s 2015 and 2016 surveys; details of the 2015 and 2016 scores and the percentage change between these periods are presented in Table 1.
Table 1: TI 2015-2016 scores for 2013-2015 PEFA assessment countries
| PEFA score | TI 2016 score | TI 2015 score | % change in 2015-2016 scores | |
| Armenia | 60 | 33 | 35 | -5.71% |
| Azerbaijan | 61.5 | 30 | 29 | 3.45% |
| Belarus | 49 | 40 | 32 | 25.00% |
| Bosnia & Herzegovina | 50 | 39 | 38 | 2.63% |
| Burkina Faso | 58.5 | 42 | 38 | 10.53% |
| Congo Republic | 21 | 20 | 23 | -13.04% |
| Gambia | 32 | 26 | 28 | -7.14% |
| Ghana | 27.5 | 43 | 47 | -8.51% |
| Guinea-Bassau | 14.5 | 16 | 17 | -5.88% |
| Kyrgyz Republic | 49.5 | 28 | 28 | 0.00% |
| Macedonia | 44.5 | 37 | 42 | -11.90% |
| Madagascar | 25.5 | 26 | 28 | -7.14% |
| Mauritania | 26.5 | 27 | 31 | -12.90% |
| Mongolia | 42 | 38 | 39 | -2.56% |
| Nepal | 50.5 | 29 | 27 | 7.41% |
| Papua New Guinea | 21.5 | 28 | 25 | 12.00% |
| Timor-Leste | 36 | 35 | 28 | 25.00% |
With ten of the seventeen countries in Table 1 recording either no change or a deterioration in their scores in 2016 (including Mauritania), the negative Pearson correlation between overall 2013-2015 PEFA scores and TI corruption scores for these countries strengthened from -0.41 in 2015 to -0.56 in 2016 pointing to the possible impact that poor PFM may have in facilitating corruption in the public (and private) sectors.
The World Bank noted in November 2016 that “Mauritania’s PFM system remains weak”. If countries, such as Mauritania, employ robust anti-corruption strategies, including actions to address key PFM weaknesses currently influencing corruption levels, they may in time be able to make some progress in curbing corruption.
Need to resolve a public financial management problem? Inquire now to schedule an initial online meeting.