African anti-corruption agencies’ digital platform usage

Kenya’s Ethics and Anti-Corruption Commission
Kenya’s Ethics and Anti-Corruption Commission 

Posted by David Fellows and John Leonardo [1]

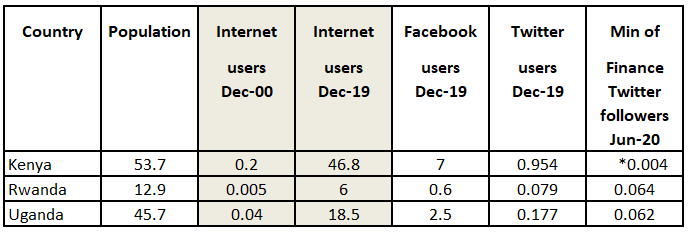
The release of TI’s 2020 Corruption Perceptions Index (CPI) on 28 January 2021 has focused attention in many countries on current corruption levels. In a recent blog we outlined the possible role social media platforms offer for promoting online public engagement in the war against corruption. We also noted that in Africa there are strong positive correlations between social media user numbers and perceived corruption levels. In this blog we review African anti-corruption agencies (ACAs) digital platform, including social networking sites, usage. Additional regional analyses will be prepared over the next six months.

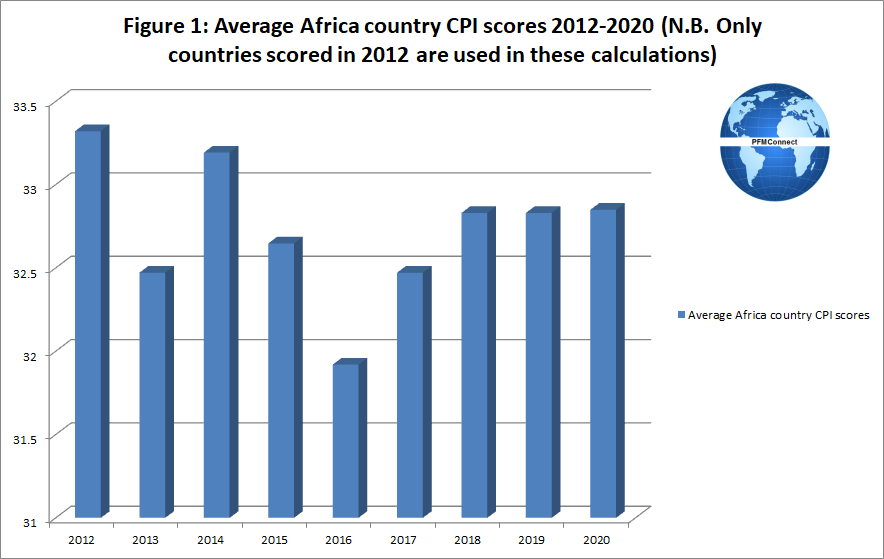
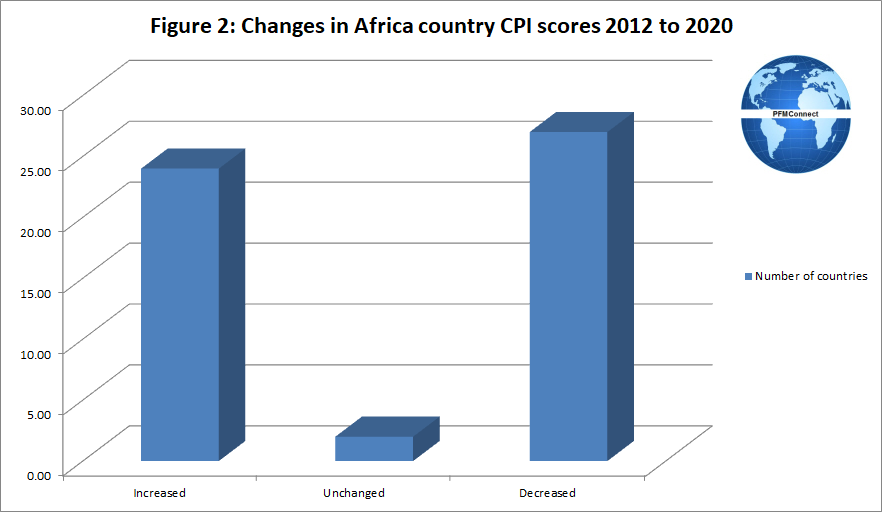
The 2020 CPI outcomes from an African perspective are disappointing as demonstrated by the trends revealed in Figures 1 and 2.

Websites and the social networking sites, Facebook and Twitter, are the digital platforms most frequently employed by African ACAs. Updates on ACA activities, developments affecting ACA operations and formal reports are featured on ACA digital platforms.

The United Nations Convention Against Corruption includes provisions relating to financial management and public reporting (Articles 9 and 10 – see Appendix). The extent of ACA compliance with these provisions has also been examined in this blog.

1. African ACAs digital platform usage

1.1 Website usage

Details of the use of websites by African ACAs as at mid-January 2021 are presented in Table 1.

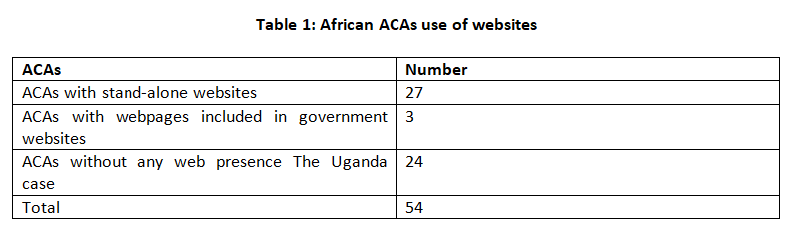
NB. Nigeria has two recognised ACAs with websites; Uganda has two recognised ACAs but only one has a website with the other using only social media sites. One Nigerian ACA with a website and the Ugandan ACA which only has social media sites are not included in Table 1 or Table 2 below.

Details of the use of websites by African ACAs in countries with relatively higher and lower 2020 CPI scores are presented in Table 2.

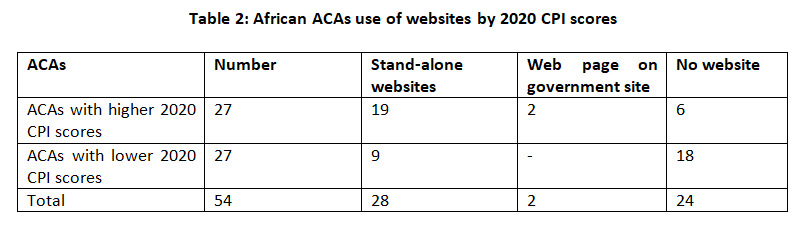
Data was available for both 2020 CPI scores and 2020 UN E-government scores in 42 countries. There is a strong positive correlation between country 2020 CPI scores and 2020 UN E-government scores for the 23 countries where ACAs have websites (for which data is available); a strong negative correlation was found for the 19 countries without ACA websites.

1.2 Website visit activity

Actual visit numbers to ACA websites in the 2020 December quarter were annualised to provide annual visit estimates which were in turn divided by country internet user numbers to provide an indication of ACA website penetration levels.

The average derived ACA website penetration level for all ACAs was very low at 0.37%. The only favourable scores were recorded by Mauritius (5.9%) and Madagascar (1.9%).

1.3 Social media activity

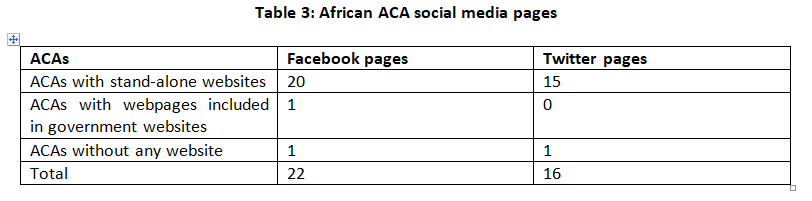
Social media follower information was analysed for ACAs with Facebook and Twitter pages using data available in mid-January 2021. Details of current Africa ACA social media pages are presented in Table 3. NB The Facebook and Twitter pages of the two Nigerian and Ugandan ACAs are included in the data presented in Tables 3, 4 and 5.

1.3.1 Facebook activity

Less than one half of the ACAs have Facebook pages.

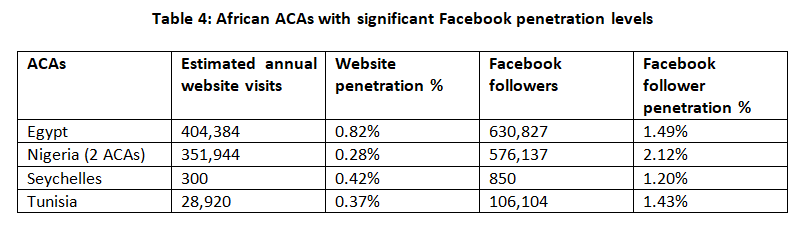
While the average Facebook penetration level for ACAs on a country basis (country ACA Facebook followers divided by total country Facebook subscribers) for the 20 countries was relatively modest at 1.06%, there were some notable exceptions.

Four of the six countries showing penetration levels in excess of the Facebook country ACA average of 1.06% also had follower numbers greater than estimated annual visits to their websites; details are presented in Table 4.

1.3.2 Twitter activity

The number of ACAs with Twitter pages is modest.

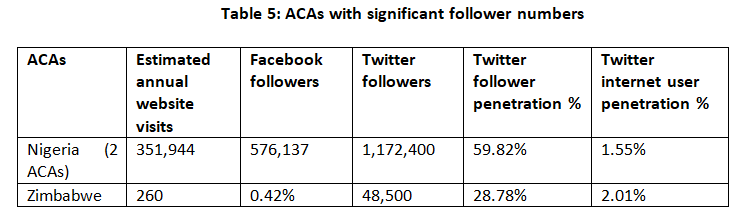
The average Twitter penetration level for ACAs on a country basis (country ACA Twitter followers divided by total country Twitter subscribers) for the 14 countries was, however, very high at 23.73%. Twitter country ACA penetration levels exceeded Twitter internet user penetration levels in six countries (Kenya, Niger, Nigeria, Rwanda, Uganda and Zimbabwe).

Two of the countries recording above average country ACA Twitter penetration levels also had Twitter follower numbers that exceeded estimated annual visits to their websites; details are provided in Table 5.

While the majority of visits to the Nigeria and Zimbabwe ACA websites were made by local residents, the local resident proportion of Twitter followers for these ACAs is not known but it is assumed to be significant.

2. Reporting activity

The availability of the following categories of key reports on ACA websites or on web pages of national government websites was examined:

  • National Anti-Corruption Strategies

  • ACA strategic plans   

  • ACA annual reports

Details of the availability of the above reports on ACA websites are presented in Table 6.

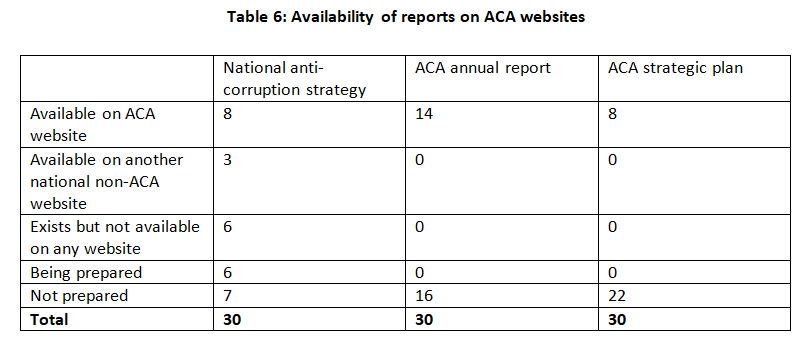
N.B. One Nigerian ACA with a website and the Ugandan ACA which only has social media sites are not included in Table 6.

Coverage of ACA digital platform activity in the above-mentioned reports, particularly those relating to social media, was also examined.

2.1 Publication of national anti-corruption strategies

Less than one-third of African ACAs with websites have published their respective national anti-corruption strategy on their website.

While the role of the media in national anti-corruption strategies is addressed in the eleven national anti-corruption strategies reviewed when preparing this blog, references to the role of social media are limited. Egypt’s National Anti-Corruption Strategy (2019-2024), Namibia’s National Anti-Corruption Strategy and Action Plan (2016-2019) and Sierra Leone’s National Anti-Corruption Strategy (2019-2023) make mention of social media activity,

The Namibia and Sierra Leone strategies outlined particular roles for social media activities. 

Morocco’s ACA published a study in 2019 that assisted its preparation of a supporting communication strategy for its National Anti-Corruption Strategy (2015-2025). This study listed social media as one of the key success factors; viz. “The body must open up on social media and have “an online platform or space”, which it must maintain and control in order to get closer to its target segments and to be responsive”.

2.2 Publication of ACA annual reports

Only 14 of the 30 African ACAs identified in Table 6 have recently published their annual reports (or de facto annual reports) on their websites. Specific reference to the use of social media was made in 8 ACA annual reports.

The Ghana ACA noted in its 2018 annual report the use of social media by the Ghana chapter of Transparency International. The Kenya ACA provided statistics about website hits and social media followers in its 2018 annual report. In its 2017 annual report the Mauritius ACA gave a detailed discussion about its social media activity including its approach for using Facebook.

The executive summary for the Morocco ACA’s 2019 annual report noted that the ACA had to address its social media strategy in the course of developing its overall communication strategy.

Brief references to the use of social media were made in the Namibia (2019), Rwanda (2019), Sierra Leone (2019) and South Africa (2020) ACA annual reports.       

2.3 Publication of ACA strategic plans

The modest number of ACA strategic plans that have been prepared recently is very surprising.

Five of the ACA strategic plans include specific references to the use of social media (Kenya, Malawi, Rwanda, Sierra Leone and Togo).  

Kenya, Malawi and Rwanda ACAs set out specific strategies and performance indicators for social media in their strategic plans. The Sierra Leone ACA set out specific strategies and progress markers while the Togo ACA set out details of the proposed launch of its website.

2.4 Overview of ACA online reporting activity

Assuming it is appropriate for all ACAs (including both Nigerian and Ugandan ACAs) to publish country anti-corruption strategies and their annual reports and strategic plans on their websites, the number of these documents that may be potentially published stands at 96 documents. Only 30 documents were published on ACA websites. This outcome falls short of the standards envisaged in the United Nations Convention against Corruption.

3. Social media performance and document publication correlations

ACA Facebook and Twitter subscriber penetration levels are weakly related to the number of ACA National Anti-Corruption Strategy, strategic plan and annual report publications placed on ACA websites.

While ACAs with relatively high Facebook and Twitter subscriber penetration levels have not generally been relatively energetic publishers of the above-mentioned reports, their social media posting activity has been sufficiently active to attract significant numbers of followers; this is most evident in the case of Kenya, Nigeria, Rwanda, Uganda and Zimbabwe.

ACA Facebook and Twitter subscriber penetration levels have, with a few exceptions, often substantially exceeded ACA website penetration levels.

4. Conclusion

The survey demonstrates a very limited level of publication on ACA websites of ACA reports in the three key categories identified in section 2.

It could add credibility to ACA professionalism and integrity to publish these reports even if some of the more sensitive detail concerning methodology and programming was omitted.

While ACA websites offer potential public engagement opportunities, social media activity has the potential for even higher engagement levels. It should be borne in mind that social media use in Africa, while a relatively recent phenomenon, is rapidly becoming extremely popular. The analysis demonstrates that while overall ACA use of social media is relatively limited, some ACAs have made considerable progress, particularly with the use of Twitter.

Those ACAs with websites but who currently do not have Facebook or Twitter pages should certainly consider these social networking sites as a means to gaining public confidence in anti-corruption activities and their cooperation in combatting anti-corruption investigations.

Appendix: United Nations Convention Against Corruption

Financial management and public reporting provisions

Article 9

Public procurement and management of public finances

2. Each State Party shall, in accordance with the fundamental principles of its legal system, take appropriate measures to promote transparency and accountability in the management of public finances. Such measures shall encompass, inter alia:

(a) Procedures for the adoption of the national budget;

(b) Timely reporting on revenue and expenditure;

(c) A system of accounting and auditing standards and related oversight;

(d) Effective and efficient systems of risk management and internal control; and

(e) Where appropriate, corrective action in the case of failure to comply with the requirements established in this paragraph.

Article 10

Public reporting

Taking into account the need to combat corruption, each State Party shall, in accordance with the fundamental principles of its domestic law, take such measures as may be necessary to enhance transparency in its public administration, including with regard to its organization, functioning and decision-making processes, where appropriate. Such measures may include, inter alia:

(a) Adopting procedures or regulations allowing members of the general public to obtain, where appropriate, information on the organization, functioning and decision-making processes of its public administration and, with due regard for the protection of privacy and personal data, on decisions and legal acts that concern members of the public;

(b) Simplifying administrative procedures, where appropriate, in order to facilitate public access to the competent decision-making authorities; and

(c) Publishing information, which may include periodic reports on the risks of corruption in its public administration.

[1] David Fellows is an international development PFM advisor who previously worked extensively in UK local government finance and in the Cabinet Office. He was a leader for the introduction of digital communication in UK public service delivery. John Leonardo is a PFM expert with extensive worldwide experience. They are both directors of PFMConnect, a consultancy providing online support in the fields of public finance and digital communication.


Freedom is what you make of it

by David Fellows [i]


  1. UK Governments can no longer claim that EU rules prevent necessary changes to improve the UK economy or the life prospects of UK citizens. The UK’s decisions may have some tariff consequences but there is no EU veto or imperative that would lead us to doing those things that run counter to our best interests. After the deal was done in December the PM remarked “freedom is what you make of it”. Surely this will be his epitaph but will it be a celebratory one?
  2. The time is rapidly approaching when we must learn of the Government’s detailed plans for fulfilling the PM’s promise to level up the regions.  We shall then see what effort and risks ministers and senior civil servants consider appropriate to honour the pact with those who made Brexit possible by changing allegiances at the last general election.
  3. Challenges abound for all participants. Local authorities, for instance, can offer valuable insights and assistance with delivery. Naturally they will want to put their own stamp on initiatives. In doing this some may make untenable demands, vilifying Government merely for political purposes. Making a start with the most constructive partners is surely important. An advance guard must be identified capable of identifying the route to success.
  4. The adequacy of key public sector organisations must be considered. For instance, how is the private sector to be effectively incentivised to participate? Can the woeful state of skill training be improved and properly presented to those who could benefit? How are start-ups and small businesses to be supported in a practical manner? How should business regulation be simplified to encourage enterprise while maintaining British values? How and to what extent could universities be tasked to make a meaningful contribution with funding skewed to reflect support for local enterprise development? How is the huge heft of public procurement to be employed? Is this the moment to create regional investment institutions to support private enterprise and if so, in what form?
  5. The private sector must be invited to make a major contribution to this agenda. Brexit has not shown the sector’s representative bodies in a particularly constructive light. They must demonstrate a capacity to contribute or be circumvented. One way or another the sector must be encouraged to provide ideas and resources that are appropriate and of long-term benefit to regional development.
  6. No one has ‘the’ answer. The public sector is diverse, resource hungry and often politically divided. The private sector is competitive, risk averse, self-interested. Representative bodies of all kinds have limited, common-denominator agendas. Consultancies tend to provide answers that they hope will lead to repeat business. This is not a task to be resolved purely by conference or working group. The answer must be derived from an unruly discourse that generates ideas from a series of interactions across all issues involving many different organisations and individuals, producing contributions that are more revealing than manicured.
  7. The general public must also have an understanding and an opportunity to contribute to this agenda. The remaking of the regions and the consequent clarification of the opportunities for London and the South East are about reshaping opportunities for communities, families and individuals.
  8. The task entails the rebalancing of the relationship between the wider London area and the regions. Ultimately the responsibility for a successful outcome of this immense task lies with Government. It should be approached with this clearly in mind. There must be both local and national ownership, public and private sector engagement. The national contribution is pivotal and should be recognised through branding and governance.
  9. This may not seem the best time for such an adventure. The virus has caused serious economic and personal damage. Restrictions will continue for some time while huge expenditure has already been incurred. Some say that this is the time to recognise and reinforce what works, time to throw everything behind the pulling power of London and the South East. They caution against forsaking the golden goose. Of course this is a fallacy borne of anxiety when the currency is realism. London does not work nor do the regions. The one lacks liveability, the other lacks opportunity both need attention. It is time to face facts, there was never a golden age.
  10. The digital technology had been slowly revealing our needs and suggesting options. Covid-19 has caused us to build on these developments, changing our attitudes and  behaviour with astonishing speed. The Covid-19 experience has also provided Government with invaluable lessons about joined up working and the need to achieve steadfast alignment between messaging, planning and execution.
  11. Things will never be quite the same again. It is time to embrace change, we just need to do it properly.   

[i] David Fellows has worked extensively in UK local government and in the Cabinet Office
as an advisor on local government reform. He is a director of PFMConnect, a
public financial management and digital communication consultancy: david.fellows@pfmconnect.com


Digital Media, Transparency and the War Against Corruption

Posted by David Fellows and John Leonardo[1]

Corruption is highly damaging to economic and social life through misappropriation of public funds, restriction of open market activity, favouritism towards families of those in power, and the many detrimental effects of rent seeking. In this piece we review evidence for the power of transparency to reduce corruption and improve economic performance. We then consider the increasing relevance of digital media, particularly social media, to the transparency agenda and how its application can be encouraged.

Economic performance, transparency and corruption

The IMF’s‘ Framework for Enhanced Fund Engagement’ 2018 noted that (i) transparency is significantly correlated with a perceptions-based indicator of the control of corruption; (ii) higher levels of corruption are typically correlated with lower growth; and (iii) corruption and governance are significantly associated with average long-run per capita growth, investment, and revenue. The IMF’s Fiscal Monitor: Curbing Corruption (April 2019 edition) shows that the least corrupt governments can collect considerably more in taxes than those at the same level of economic development. In a blog announcing this guidance Christine Lagarde, then Managing Director of the IMF, affirmed the importance of transparency by commenting that; ‘At the end of the day, the most durable “cure” for corruption is strong, transparent, and accountable institutions’.

How governments may involve digital media

The World Bank DocumentEnhancing Government Effectiveness and Transparency: The Fight Against Corruption’ (September 2020) details studies in which developing countries have sought to combat corruption by improving transparency.

It instances:

  • The identification of corruption relating to infrastructure projects in Columbia by the Government urging citizens to publicize unfinished projects.
  • The introduction of participatory budgeting in Brazil where one study found that adopter municipalities achieved a 39% higher tax collection than those that had not.
  • The use of Beneficial Ownership declarations in the Ukraine where online access to records promises significant advantages following a chequered introductory experience.
  • Public reporting of Supreme Audit Institution (SIA) findings in Ghana, and India’s practice of encouraging the public to comment on SIA reports and provide evidence of misdeeds.

These are all public engagement activities that can most readily be undertaken via digital media.

The impact of social media

Social media is a growing phenomenon across the developing world. It can be used by governments to encourage citizens to make their views known (figures in million).

 Note: *Kenya’s Anti-Corruption Agency has 293,000 Twitter followers

A survey of Kenyan social media users conducted by SIMELab in 2020 suggested that social media use was becoming highly age specific.

The survey identified the three most used media as WhatsApp (89%), Facebook (82%) and YouTube (58%). TIFA Research has identified Facebook as the current most effective advertising platform.

The African public accountability movement Connected Development (CODE) based in Nigeria uses digital media to help marginalised communities monitor public service investment employing its ‘follow the money’ slogan. A current focus is COVID-19 expenditure.

We have analysed the correlation between Transparency International’s 2019 CPI scores for the 48 best performing African Countries included in the index where both Facebook and Twitter services were available. There are strong positive correlations between social media user numbers and perceived corruption levels. This result seems consistent with the transparency/corruption relationship found in the IMF Framework for Enhanced Fund Engagement, reflecting public interest in government affairs and corruption.

A growing relationship between formal digital media and social media

Over the past year online news media have reported government initiatives against corruption and investigated acts of corruption. Two examples:

  • On 11th November 2020 the Cyprus Mail commented that: ‘without (greater) public support, anti-corruption groups are unlikely to attain their objectives, because the politicians will have no reason to take any notice of them’.
  • On 21st November 2020ABS-CBN News reported that a task force investigating Philippine Government corruption led by Justice Secretary Menardo Guevarra had received at least 60 complaints during the previous two weeks.

These causes could benefit from social media use by community activists (Cyprus) and the government (Philippines).

Conclusions

The economic impact of the COVID-19 pandemic on developing countries brings the prospect of reduced national resources unless and until these countries can address their corruption challenges. 

Formal online media have helped increase transparency in recent times. Further, social media is fast becoming an important form of popular communication throughout the developing world. The targeted use of social media platforms presents an effective opportunity for online public engagement that makes messaging easy to assimilate and respond to.

Governments can use social media to seek public support for reporting anti-corruption activities, complaining about unfair decisions and exposing the accumulation of unexplained wealth by politicians and officials. Such engagement is, however, dependent on the demonstration of government integrity, the recognition of public priorities, and the provision of basic information on services and funding to local communities.

The international development community can encourage governments to uphold press freedom, protect whistle-blowers and use social media as part of the transparency process, and scale up its support to countries that are pursuing effective anti-corruption policies.

A supporting video is available here.

[First published by IMF PFM Blog 7thJanuary 2021]


[1] David Fellows is an international development PFM advisor who previously worked extensively in UK local government finance and in the Cabinet Office. He was a leader for the introduction of digital communication in UK public service delivery. John Leonardo is a PFM expert with extensive worldwide experience. They are both directors of PFMConnect, a consultancy providing online support in the fields of public finance and digital communication (david.fellows@pfmconnect.com).


Regional Pacific SIDS PFM digital transparency update

Our June 2020 video “Improving PFM digital transparency in SIDS finance ministries” examined finance ministries (MoFs) use of digital platforms such as websites and social media to provide public financial management (PFM) related information in small island developing states (SIDS). Recent PFM digital transparency regional trends in Pacific SIDS are examined in our “Regional Pacific SIDS PFM digital transparency update” video.

Pacific SIDS PFM digital transparency regional trends

PFM digital transparency trends were analysed for 11 Pacific SIDS where MoF websites were active in the 2020 September quarter to provide the basis for this regional trends analysis:

  • Cook Islands
  • Fiji
  • Kiribati
  • Marshall islands
  • Micronesia
  • Northern Marianas
  • Papua New Guinea
  • Samoa
  • Tonga
  • Tuvalu
  • Vanuatu

Seven Pacific SIDS did not have active MoF websites in the 2020 September quarter.

Charts for the following regional indicators are presented:

  • MoF website penetration levels for the 2020 March and September quarters. The figures used in these charts were obtained using a two-step process. Actual visit data for the March and September 2020 quarters was annualised to provide projections of estimated 2020 visits. The resulting 2020 annual MoF website visit projections were divided by the number of country internet users to obtain MoF website penetration levels.
  • Domestic and non-resident visits to MoF websites for the 2020 March and September quarters; these charts reflect the percentage of visits to MoF websites attributable to local residents and non-residents in the 2020 March and September quarters based on actual visit data.
  • Rates of change in MoF website visits; this data is based on changes to MoF visit levels between the 2020 March and September quarters. 
  • MoF Facebook penetration levels as at June 2020 and October 2020; these figures were obtained by dividing actual MoF Facebook follower numbers by the number of country Facebook subscribers.
  • Changes in Facebook follower numbers between June 2020 and October 2020; these charts reflect changes in the respective MoF Facebook follower numbers.

Currently, no Pacific SIDS MoFs maintain Twitter accounts.

Key regional analysis findings

Some of the key findings from our analysis are as follows:

  • Estimated total Pacific SIDS MoF 2020 visits in the 2020 September quarter were 13.10% higher than in the 2020 March quarter for the 10 MoFs where data was available for both quarters

  • Total Pacific SIDS local resident MoF visits to the above-mentioned 10 MoF websites increased by 375% in the 2020 September quarter over the 2020 March quarter whilst total non-resident MoF visits fell by 50%

  • Pacific SIDS MoF Facebook follower numbers (and overall Pacific SIDS average MoF Facebook penetration level) increased by 41.31% between June 2020 and October 2020