Bosnia & Herzegovina Public Financial Management Profile

Bk-map

Introduction

This note presents a series of charts which provide an overview of Bosnia and Herzegovina’s recent public financial management (PFM) performance based on this country’s 2014 Public Expenditure and Financial Accountability (PEFA) assessment. Comparisons are made between Bosnia and Herzegovina’s performance and the performance of the other twenty-three countries that had PEFA assessments published in 2014-2015. All analyses have been prepared using results reported from using the 2011 PEFA methodology.

Overall PFM performance

Individual country PFM performance has been determined by applying the following points scale to reported individual performance indicator (PI) scores as presented in Table 1. No points were allocated to PIs that were not scored because either data was unavailable, a D score was given or the PI was not applicable.

Table 1: PI scoring methodology

PEFA PI score

Points allocated

A

3

B+

2.5

B

2

C+

1.5

C

1

D+

.5

D

0

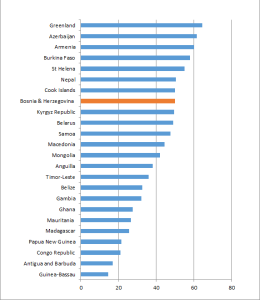
The graph in Figure 1 below shows Bosnia and Herzegovina’s overall score was ranked 8th out of the twenty-four countries.

 Figure 1: Aggregate PEFA scores for 24 countries

Bosnia & Herzegovina overall result

Details of the distribution of overall country scores across PFM performance categories, as determined by PFMConnect, are presented in Table 2. Bosnia and Herzegovina’s overall score was 50 points.

Table 2: Distribution of country PFM performance levels

PFM performance Overall Scores Number of countries
Very strong 66.37-84 0
Strong 49.57-66.36 8
Moderate 32.77-49.56 7
Weak 15.97-32.76 8
Very weak 0-15.96 1
Total 24

Bosnia and Herzegovina’s overall PFM performance is classified as “strong”.

PI performance

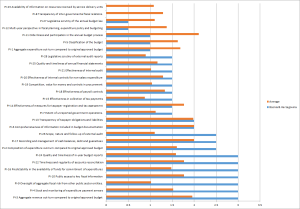
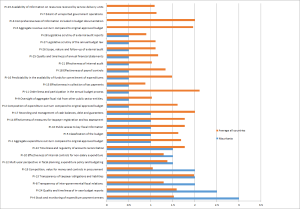
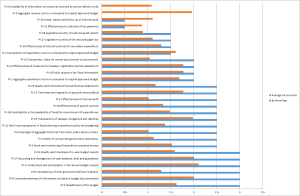
The graph in Figure 2 below shows the scores for Bosnia and Herzegovina’s individual PIs compared with the average score recorded for each PI across the twenty-four PEFA assessments we have studied. Please note that no scores were recorded for the top two indicators in Figure 2 (PI-8 and PI-23) as these indicators were not applicable in the case of Bosnia and Herzegovina.

 Figure 2: Bosnia and Herzegovina PI score comparisons

Bosnia & Herzegovina relative performance PIs

Download a pdf version of Figure 2 here (Bosnia and Herzegovina PIs) to review individual PI scores in more detail.

Twenty-six PIs were assessed. Nineteen PIs had scores above the country average, one PI had a score equal to the country average whilst six  PIs had scores below the country average.

Performance across key PFM activities

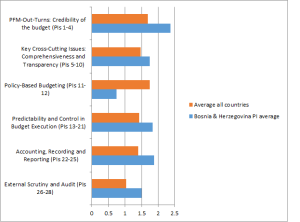
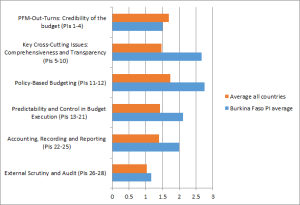
The graph in Figure 3 below shows the average scores for the six key PFM activities compared with the average score recorded for these activities across the twenty-four country PEFA assessments we have studied.

 Figure 3: Bosnia and Herzegovina key PFM activity comparisons

Bosnia & Herzegovina - relative performance for key PFM activities

Five key PFM activities recorded scores above the country average whilst one activity recorded a score below the country average.

PEFA ASSESSMENT

You can download the 2014 PEFA assessment for Bosnia and Herzegovina here.


Mauritania Public Financial Management Profile

Mauritania-CIA_WFB_Map

Introduction

This note presents a series of charts which provide an overview of Mauritania’s recent public financial management (PFM) performance based on this country’s 2014 Public Expenditure and Financial Accountability (PEFA) assessment. Comparisons are made between Mauritania’s performance and the performance of the other twenty-three countries that had PEFA assessments published in 2014-2015. All analyses have been prepared using results reported from using the 2011 PEFA methodology.

Overall PFM performance

Individual country PFM performance has been determined by applying the following points scale to reported individual performance indicator (PI) scores as presented in Table 1. No points were allocated to PIs that were not scored because either data was unavailable, a D score was given or the PI was not applicable.

Table 1: PI scoring methodology

PEFA PI score

Points allocated

A

3

B+

2.5

B

2

C+

1.5

C

1

D+

.5

D

0

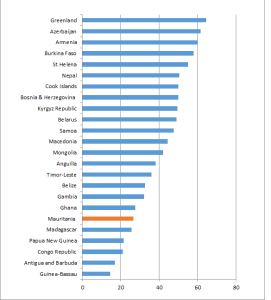
The graph in Figure 1 below shows Mauritania’s overall score was ranked 19th out of the twenty-four countries.

 Figure 1: Aggregate PEFA scores for 24 countries

Mauritania overall result

Details of the distribution of overall country scores across PFM performance categories, as determined by PFMConnect, are presented in Table 2. Mauritania’s overall score was 26.5 points.

Table 2: Distribution of country PFM performance levels

PFM performance Overall Scores Number of countries
Very strong 66.37-84 0
Strong 49.57-66.36 8
Moderate 32.77-49.56 7
Weak 15.97-32.76 8
Very weak 0-15.96 1
Total 24

Mauritania’s overall PFM performance is classified as “weak”.

PI performance

The graph in Figure 2 below shows the scores for Mauritania’s individual PIs compared with the average score recorded for each PI across the twenty-four PEFA assessments we have studied. Please note that no scores were recorded for the top four indicators in Figure 2 as these PIs (PI-3, PI-6, PI-7 and PI-23) received D scores.

 Figure 2: Mauritania PI score comparisons

Mauritania relative performance PIs

Download a pdf version of Figure 2 here (Mauritania PIs) to review individual PI scores in more detail.

Twenty-eight PIs were assessed. Seven PIs had scores above the country average whilst twenty-one PIs had scores below the country average.

Performance across key PFM activities

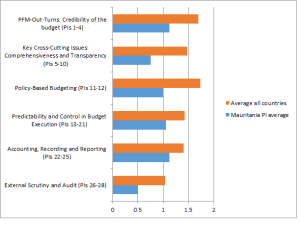
The graph in Figure 3 below shows the average scores for the six key PFM activities compared with the average score recorded for these activities across the twenty-four country PEFA assessments we have studied.

 Figure 3: Mauritania key PFM activity comparisons

Mauritania - relative performance for key PFM activities

All six key PFM activities recorded scores below the country average.

PEFA ASSESSMENT

You can download the 2014 PEFA assessment for Mauritania here.


Burkina Faso Public Financial Management Profile

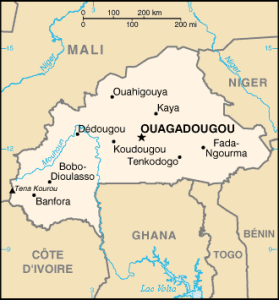
Burkina_Faso_carte

Introduction

This note presents a series of charts which provide an overview of Burkina Faso’s recent public financial management (PFM) performance based on this country’s 2014 Public Expenditure and Financial Accountability (PEFA) assessment. Comparisons are made between Burkina Faso’s performance and the performance of the other twenty-three countries that had PEFA assessments published in 2014-2015. All analyses have been prepared using results reported from using the 2011 PEFA methodology.

Overall PFM performance

Individual country PFM performance has been determined by applying the following points scale to reported individual performance indicator (PI) scores as presented in Table 1. No points were allocated to PIs that were not scored because either data was unavailable, a D score was given or the PI was not applicable.

Table 1: PI scoring methodology

PEFA PI score

Points allocated

A

3

B+

2.5

B

2

C+

1.5

C

1

D+

.5

D

0

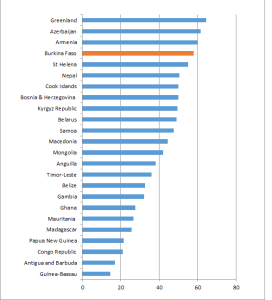
The graph in Figure 1 below shows Burkina Faso’s overall score was ranked 4th out of the twenty-four countries.

 Figure 1: Aggregate PEFA scores for 24 countries

Burkina Faso overall result

Details of the distribution of overall country scores across PFM performance categories, as determined by PFMConnect, are presented in Table 2. Burkina Faso’s overall score was 58 points.

Table 2: Distribution of country PFM performance levels

PFM performance Overall Scores Number of countries
Very strong 66.37-84 0
Strong 49.57-66.36 8
Moderate 32.77-49.56 7
Weak 15.97-32.76 8
Very weak 0-15.96 1
Total 24

Burkina Faso’s overall PFM performance is classified as “strong”.

PI performance

The graph in Figure 2 below shows the scores for Burkina Faso’s individual PIs compared with the average score recorded for each PI across the twenty-four PEFA assessments we have studied. Please note that no scores were recorded for the top two indicators in Figure 2 as the two PIs (PI-3 and PI-23) received D scores.

 Figure 2: Burkina Faso PI score comparisons

Burkina Faso relative performance PIs

Download a pdf version of Figure 2 here (Burkina Faso PIs) to review individual PI scores in more detail.

Twenty-eight PIs were assessed. Twenty-three PIs had scores above the country average whilst five PIs had scores below the country average.

Performance across key PFM activities

The graph in Figure 3 below shows the average scores for the six key PFM activities compared with the average score recorded for these activities across the twenty-four country PEFA assessments we have studied.

 Figure 3: Burkina Faso key PFM activity comparisons

Burkina Faso - relative performance for key PFM activities

Five key PFM activities recorded scores above the country average whilst the remaining key PFM activity recorded a score below the country average.

PEFA ASSESSMENT

You can download the 2014 PEFA assessment for Burkina Faso here.


Asian Development Bank’s PPP Offering

Delhi bus terminal

New fund to assist PPP preparation

On 25 January 2016 the ADB launched its fund to finance preparatory costs for creating partnerships with private sector counterparts for the development of essential infrastructure projects. Such arrangements are seen as attracting private sector expertise and financial backing to unlock national economic potential and provide much needed services.

Past experience highlights the need for a PPP preparation funding mechanism

Public private partnerships (PPPs) have had a chequered history in the west over the past two decades. Agreements are highly complex and extend over long periods during which public sector needs and priorities can change leaving heavy financial penalties for premature termination or variation to initial service concepts. The sharing of risk is part of the case for governments entering joint ventures of this kind but the private sector has proved highly adept at distancing itself from risk when contracts are written.

Clearly the right projects need to be selected and contracts written with foresight, fairness and flexibility if cash strapped nations are to avoid perfect solutions turning into perfect nightmares. This new investment fund is clearly designed to support sound projects that are captured in agreements that provide a fair deal for all.

See PFMConnect’s new PPP board posted yesterday on Pinterest.  It references numerous PPP projects and some cautionary expert comment.